课程 图形学 Color & Display
about 图形学颜色的本质 & 图像的显示。
属于图形学系列文章。
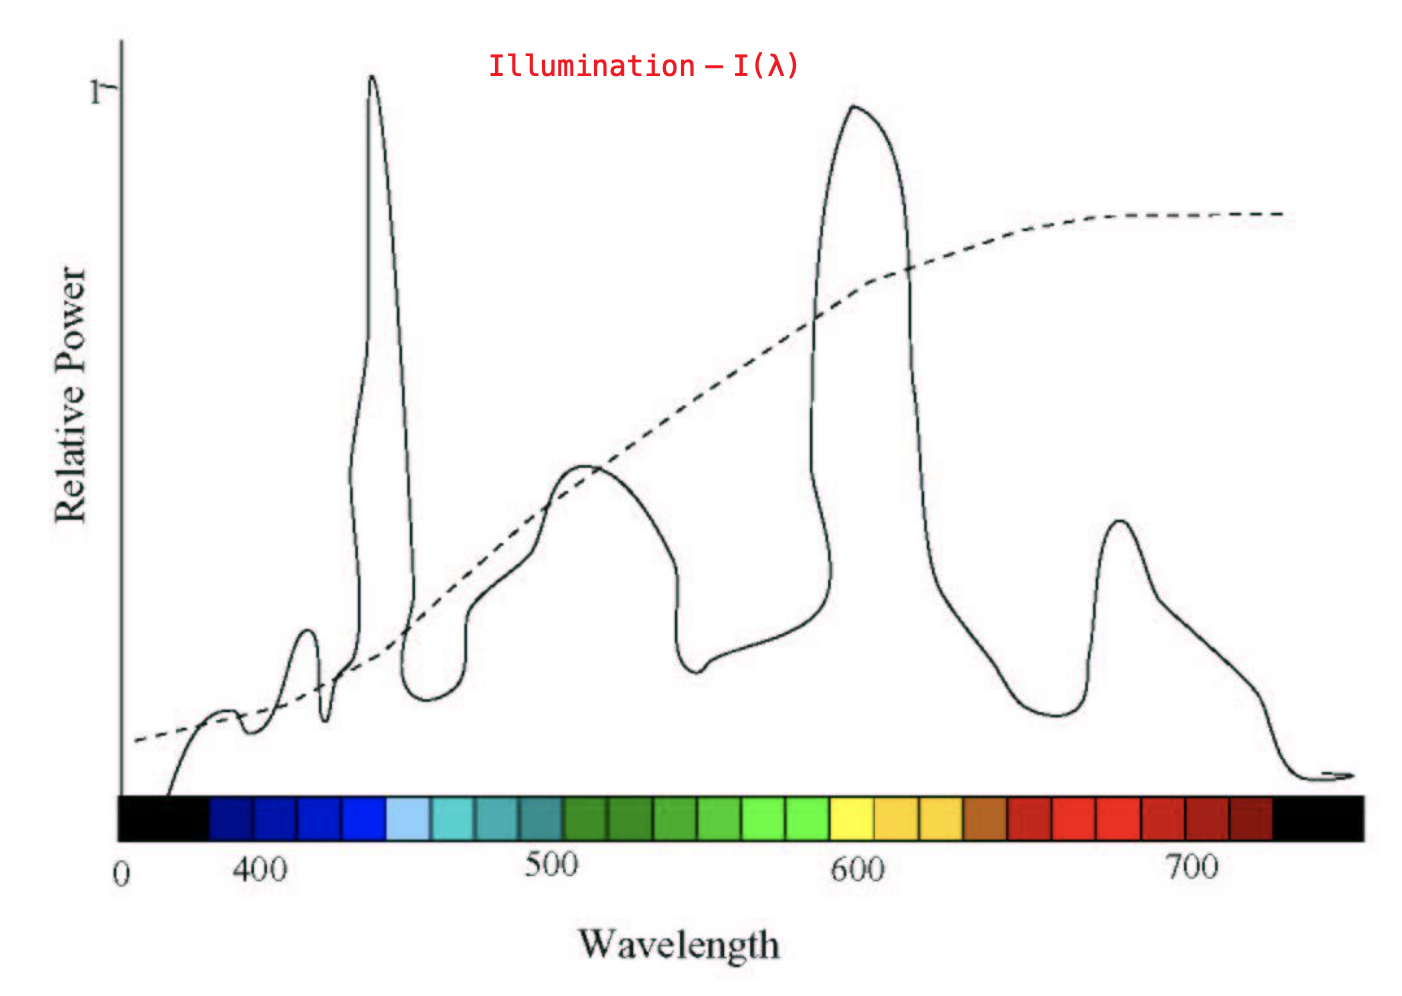
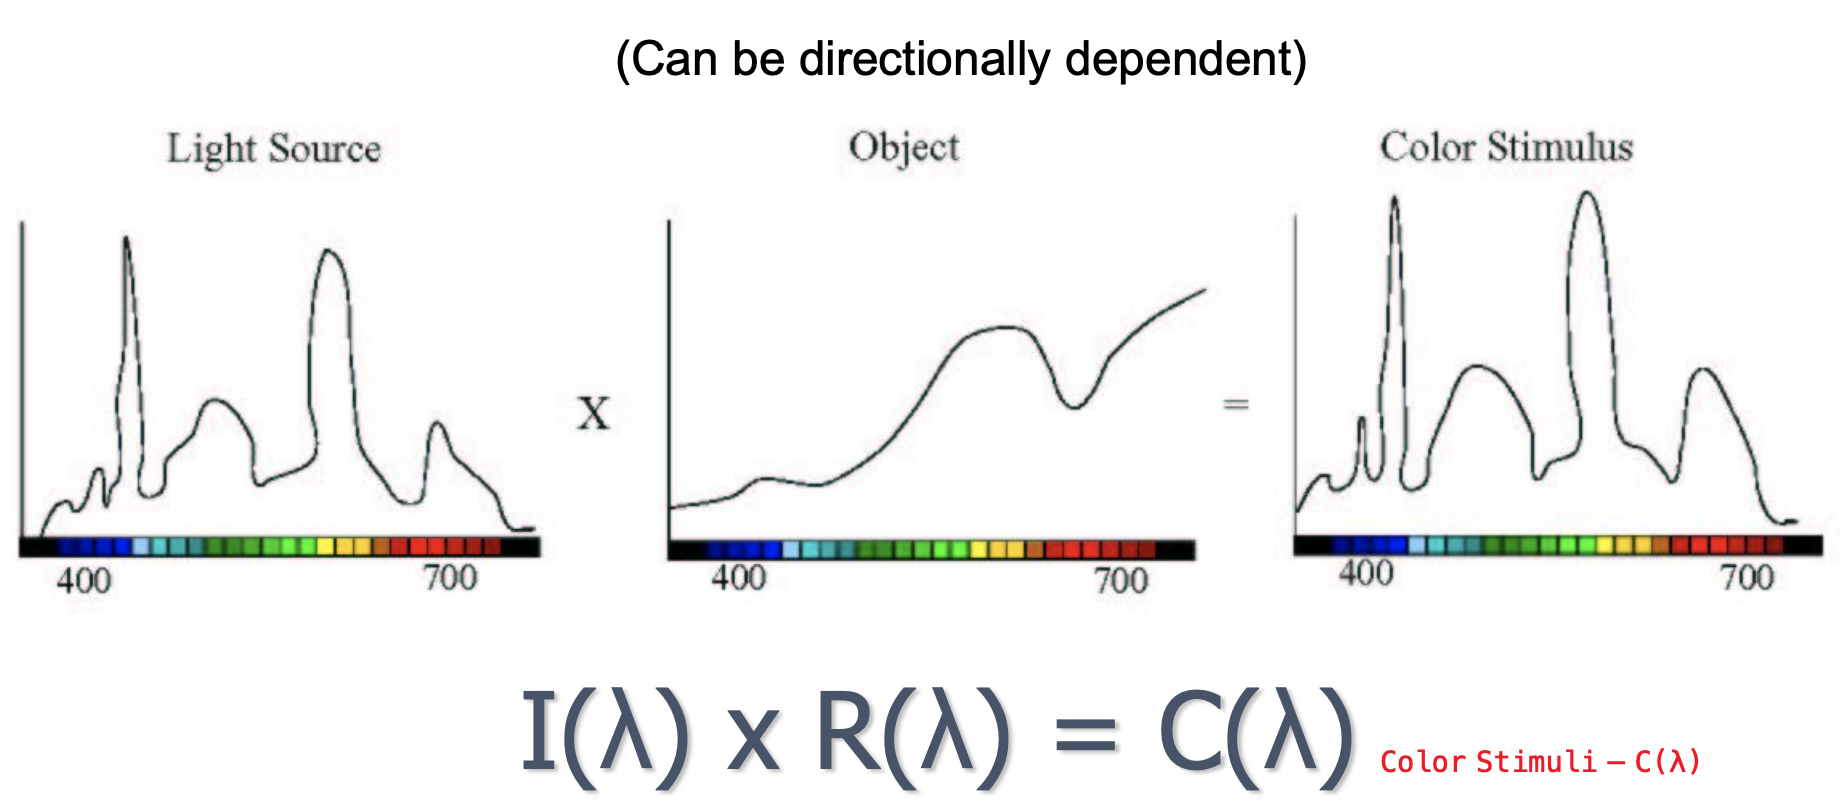
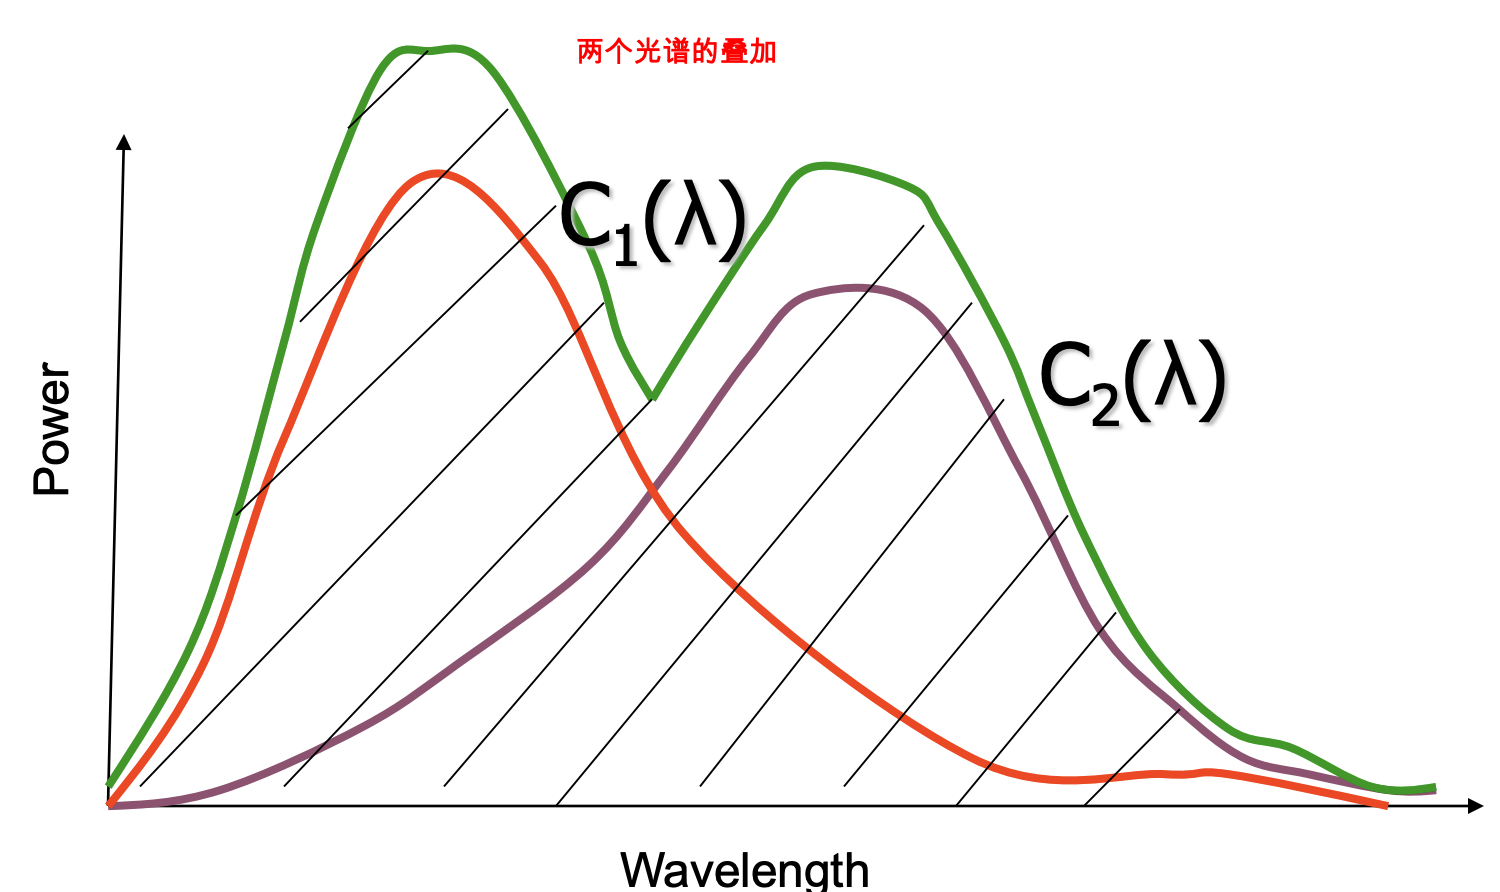
我们都知道,颜色其实是物体表面不吸收的可见光反射而成的。不同波长的可见光功率不一样(光源光谱分布曲线):
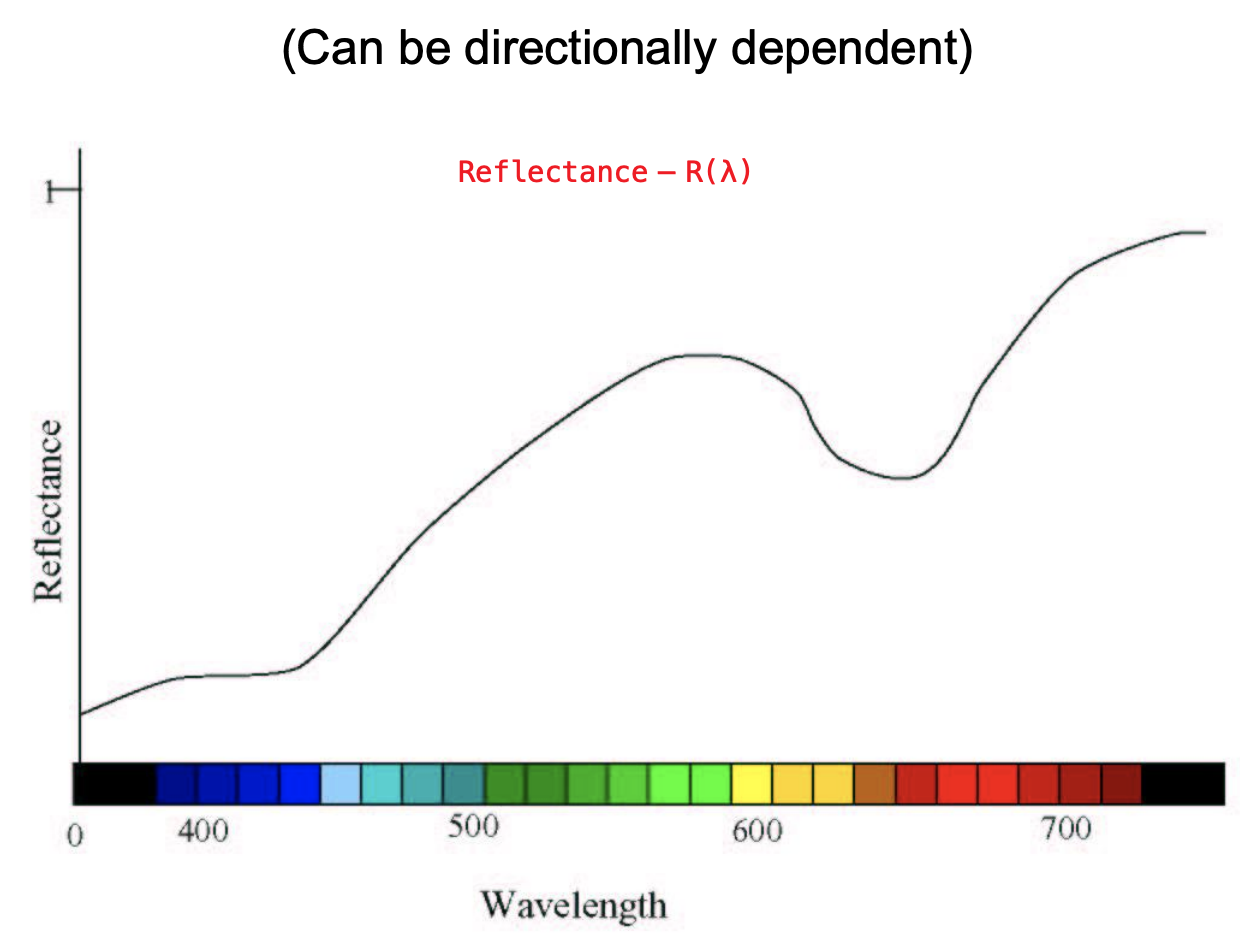
其反射程度也不一样(物体反射率曲线):
视觉刺激的表征:
Color Mixtures
1.Subtractive 场景;油漆颜料
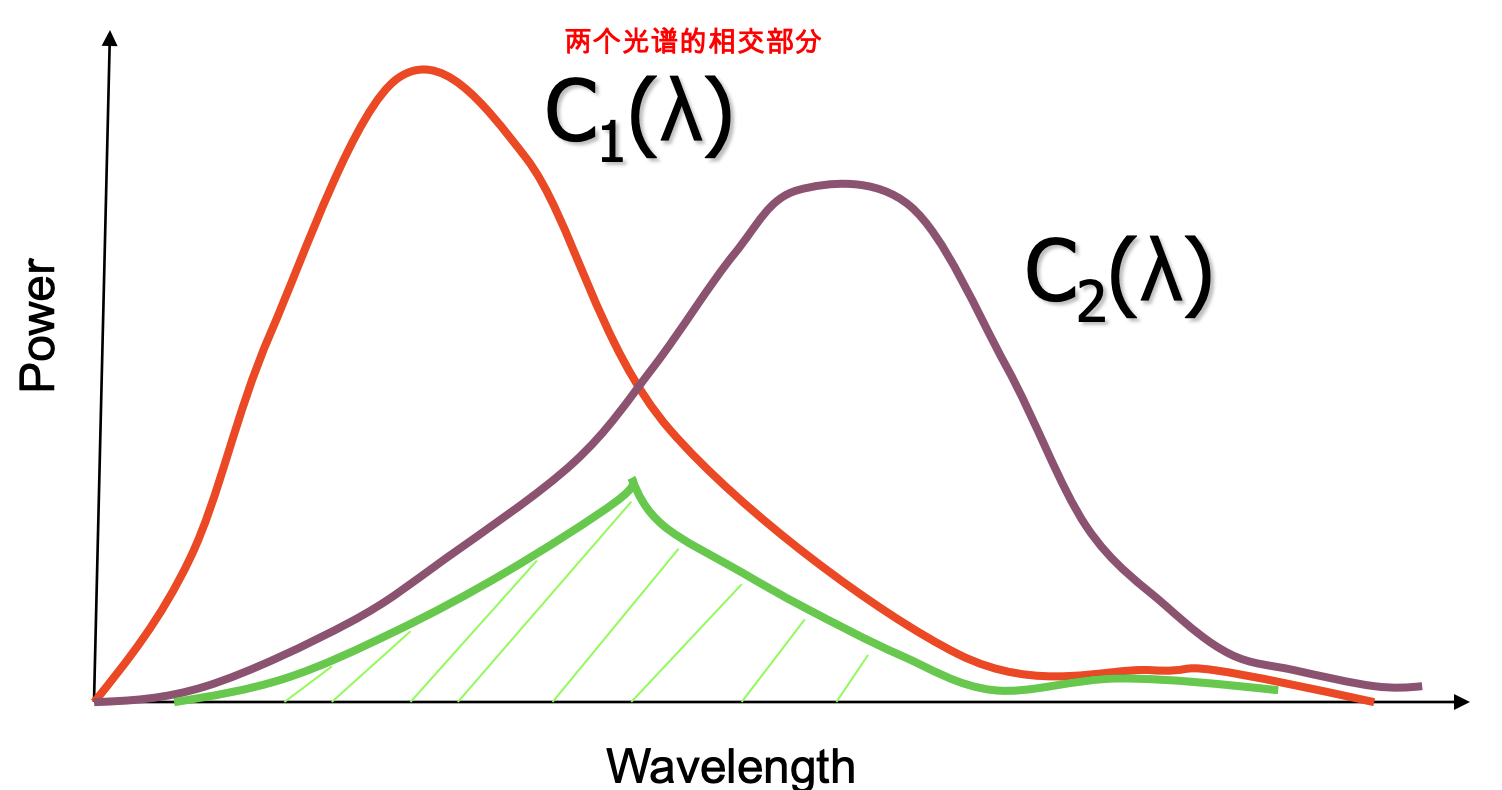
2.Additive 场景:光
CIE Functions
CIE1931色彩空间 在颜色感知中最先采用数学方式来定义的色彩空间
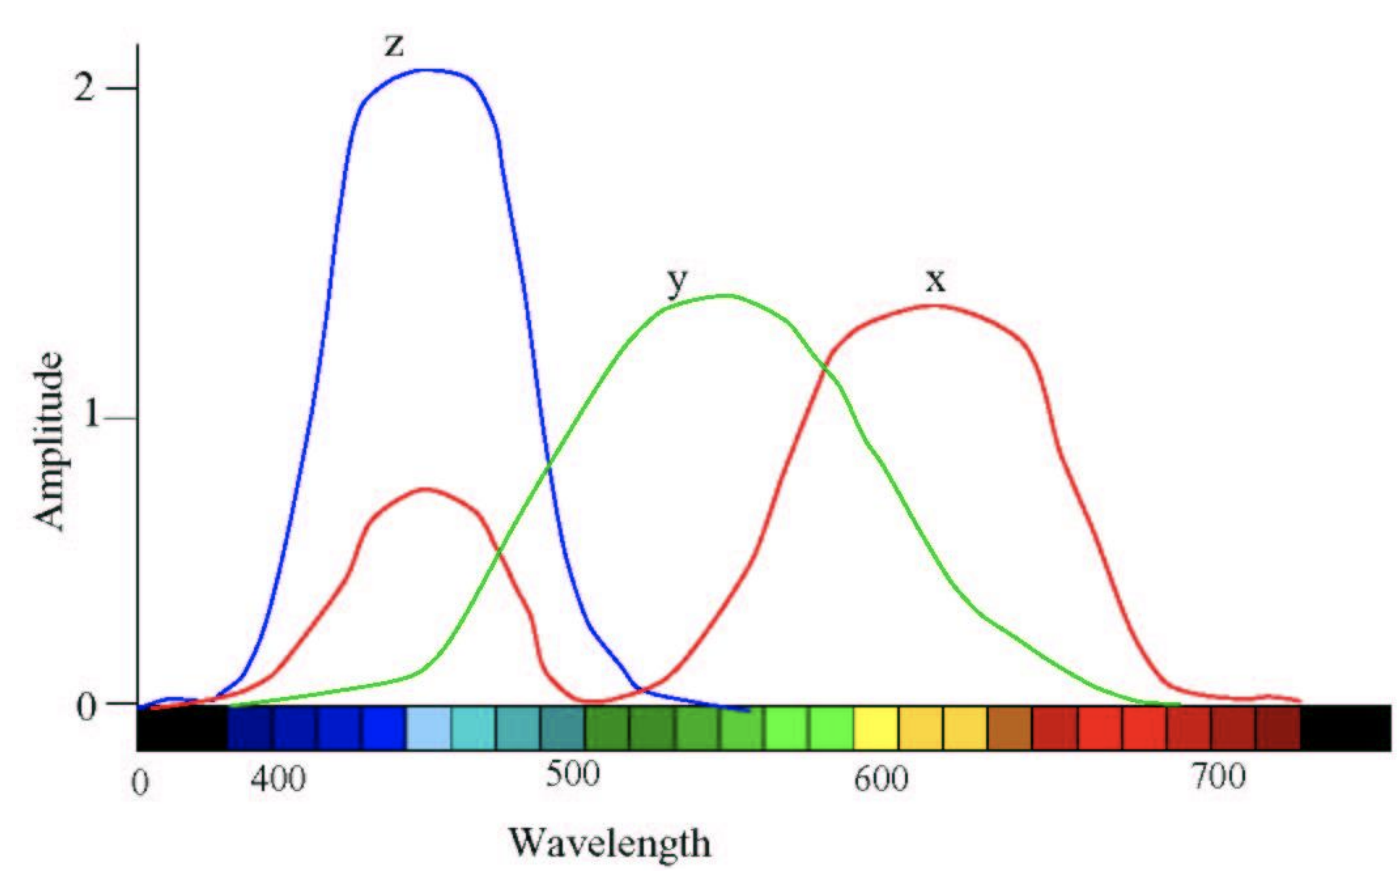
Tristimulus Values:
形象的表达:

Metamerism 条件等色,同色异谱 中文都听不懂… 英文的解释是 Two different color stimuli can generate same tristimulus values 也就是说不同的颜色产生相同的对眼睛的刺激。
This is why RGB displays work!
有关Tristimulus Values:
- XYZ forms a three dimensional space to define color
- Two colors added by just adding the XYZ coordinates
- The intensity of x(λ), y(λ) and z(λ) combining which would create a metamer of the spectrum
- Since normalized, it signifies proportions
Color Type:
- Monochromatic 激光
- Achromatic 阳光
- Polychromatic 最普遍
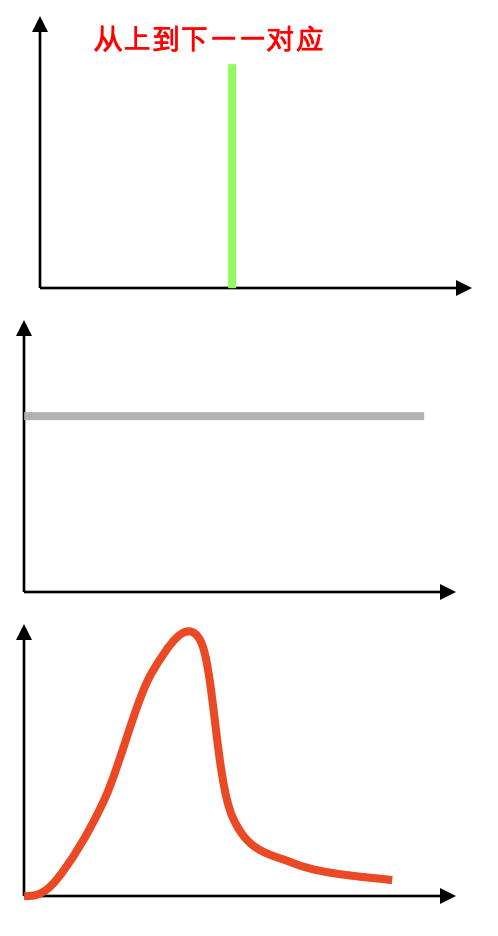
Color Properties:
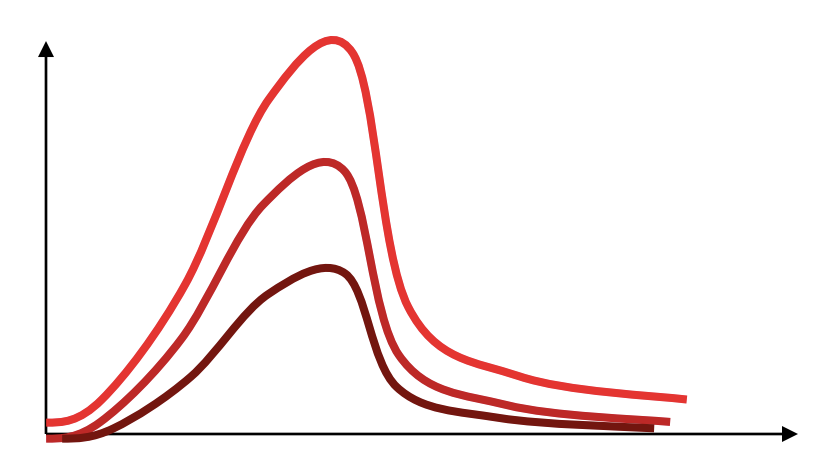
Intensity
- Amount of stimulus in cd/m2
- The absolute brightness
- Governed by the area under the curve
Hue 色调
- Predominant wavelength
- Mean
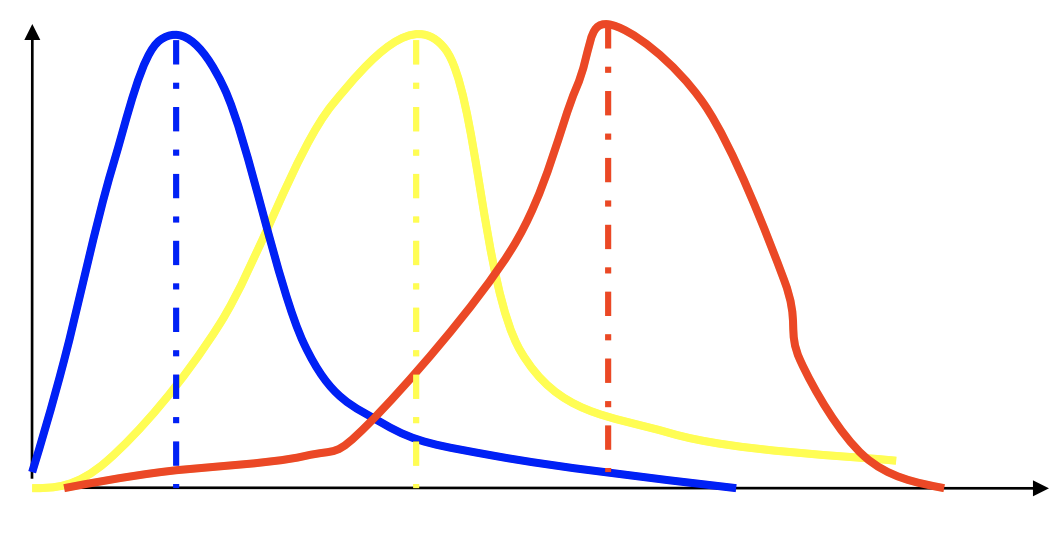
Saturation
- Amount of achromatic(消色差) light
- Variance from the mean
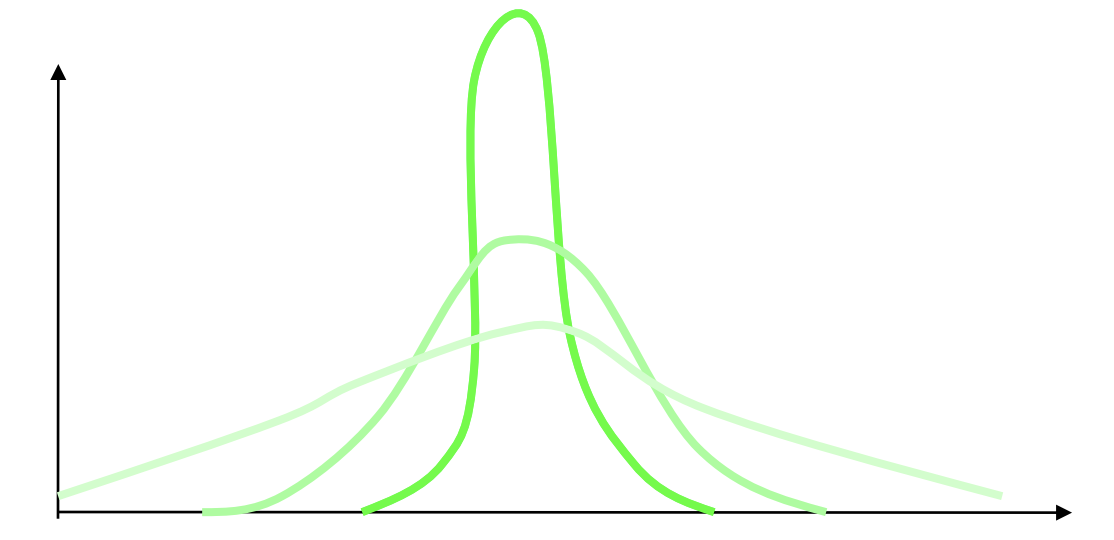
这三个属性是相互关联的,无法单独修改某一个。
当使用 XYZ 来表示颜色时:
- Intensity
- X+Y+Z
- Luminance
- Response of the green cones
- Perceived Brightness
- Y
- Hue and Saturation (Chrominance 色度)
- Using chromaticity coordinates
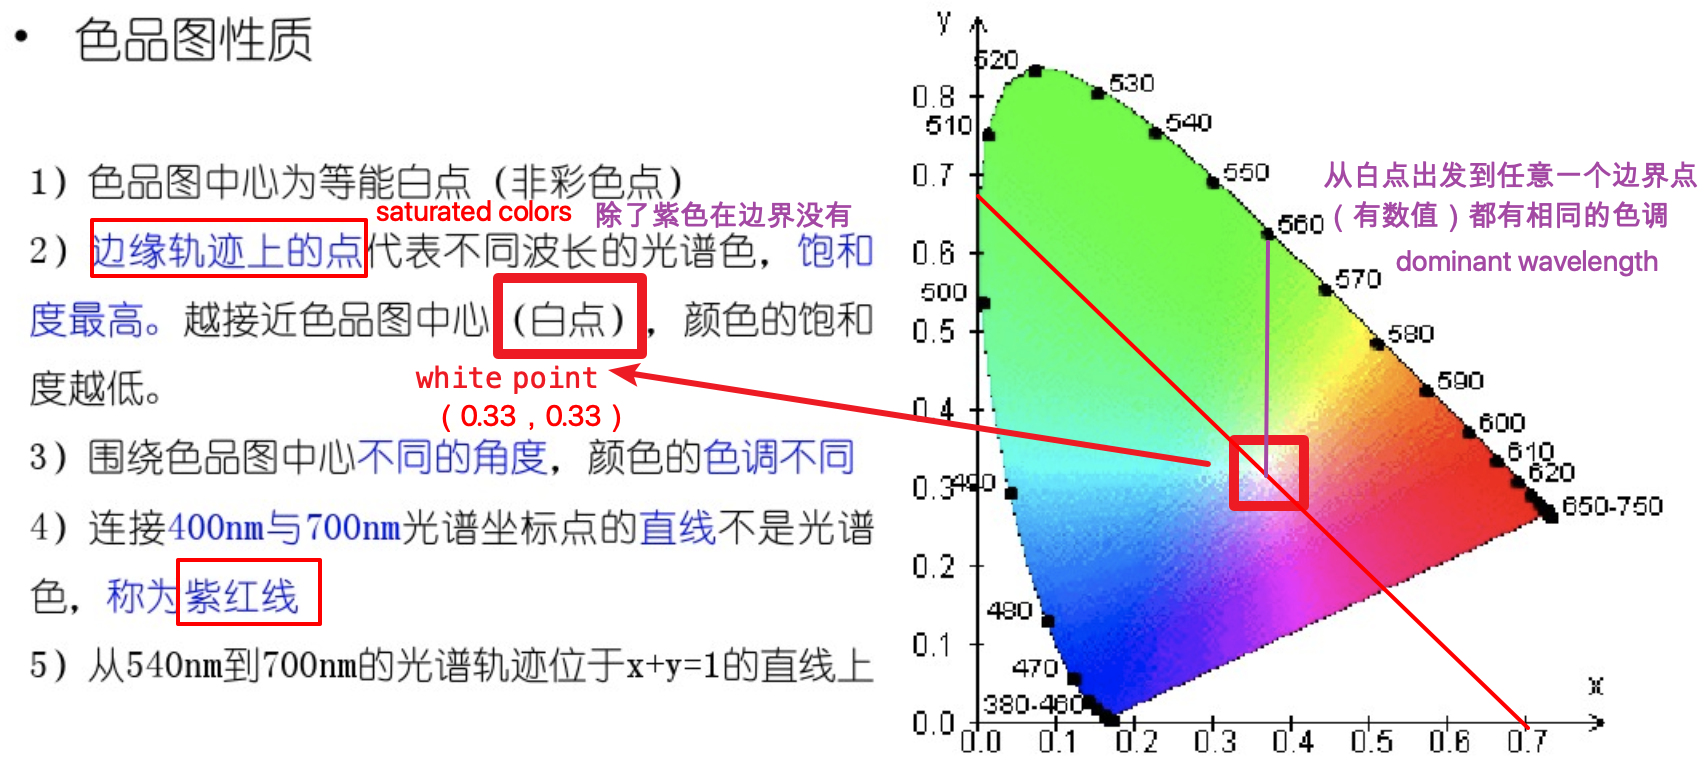
Chromaticity Chart 色度图
achromatic color 无彩色,指除了彩色以外的其它颜色,常见的有金、银、黑、白、灰。只有明度性质。它的xyz坐标值相等。
2D projection of 3D colors on X+Y+Z = d plane
Plot of x and y is the chromaticity chart
x = X/(X+Y+Z) y = Y/(X+Y+Z)
根据上述公式,我们知道 xyz 成固定比例的坐标对在色度图上的位置是一样的,他们的色度是相同的,只有强度不同。
参考:https://wenku.baidu.com/view/f3ae7cd07cd184254a353592.html
dominant wavelength 主波长 和 complementary wavelength 互补波长 是一组对应关系(如果某两种相对应颜色的光按一定比例混合,可以成为白光,那么这两种色光就称为互补色光!)我猜是穿过白点的直线与轮廓相交的两个点为互补波长。除了绿色光谱波长对应的是洋红色系的颜色,在光谱图上找不到其单色,其余颜色都能找到。
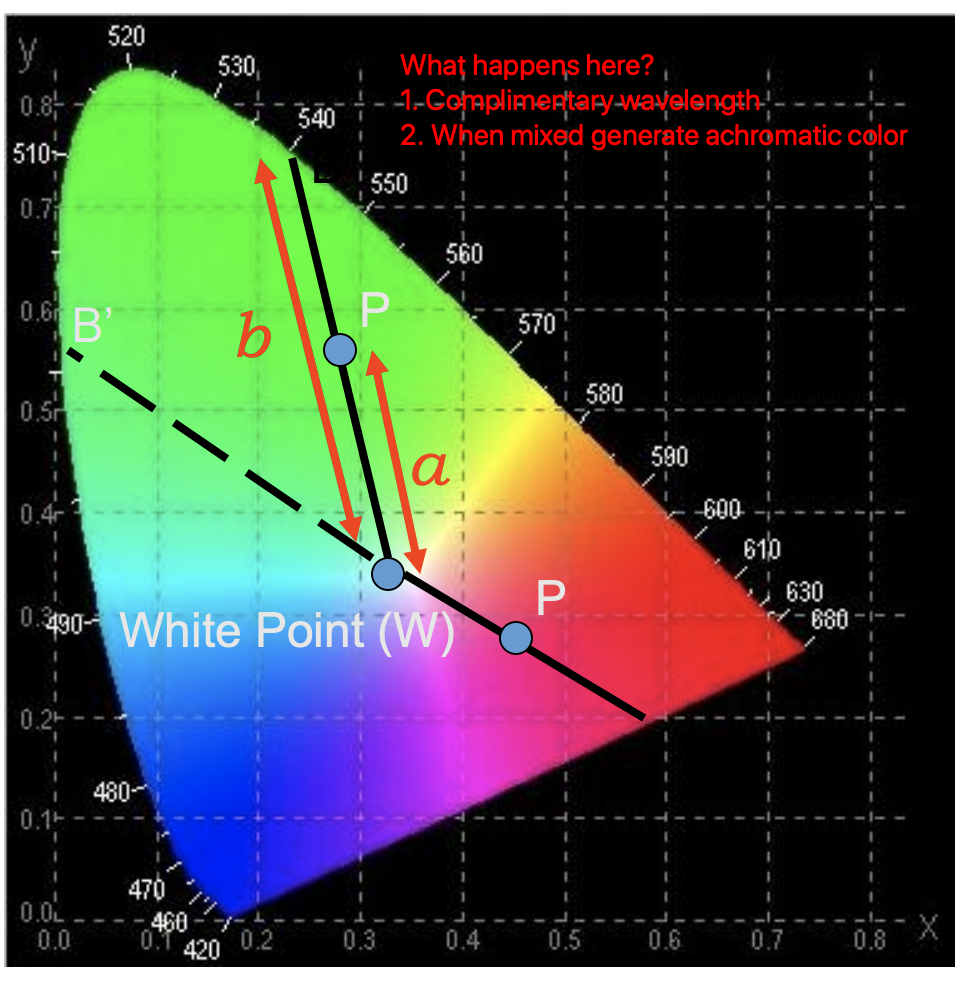
Purity (Saturation)
How far shifted towards the spectral color (= Ratio of a/b)
Purity = 1 implies spectral color with maximum saturation
How to combine colors?
- Using XYZ
- Just add them
- Using intensity and (x,y)
- Sum (x,y) weighted by proportions of their intensities to generate new (x,y)
- Add the intensities to generate new intensity
- What happens when add two colors of same hue and saturation?
- Only adds their intensities
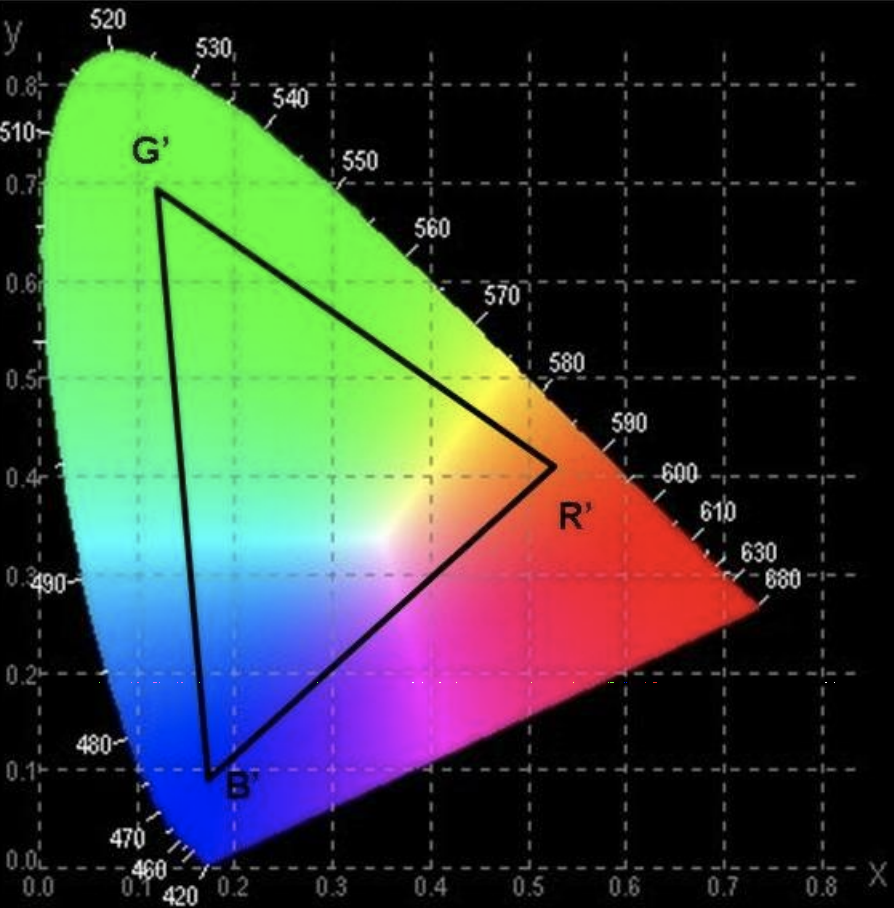
2D Color Gamut 色域
- Projection of 3D gamut on X+Y+Z=d plane
- It is a triangle on the chromaticity charts
- Shows reproducible the hue and saturation
- 例子:sRGB, aRGB, DCI-P3
Display/Sensor Model
- 仅仅是使用的原色不同(具有不同的光谱)
- 可以通过线性变换相互转换(3x3矩阵)
- RGB和XYZ之间的转换
- RGB is dependent on device (device dependent color space)
- XYZ depends on eye’s response (device independent color space)
- 这个链接有很多关于M的数据
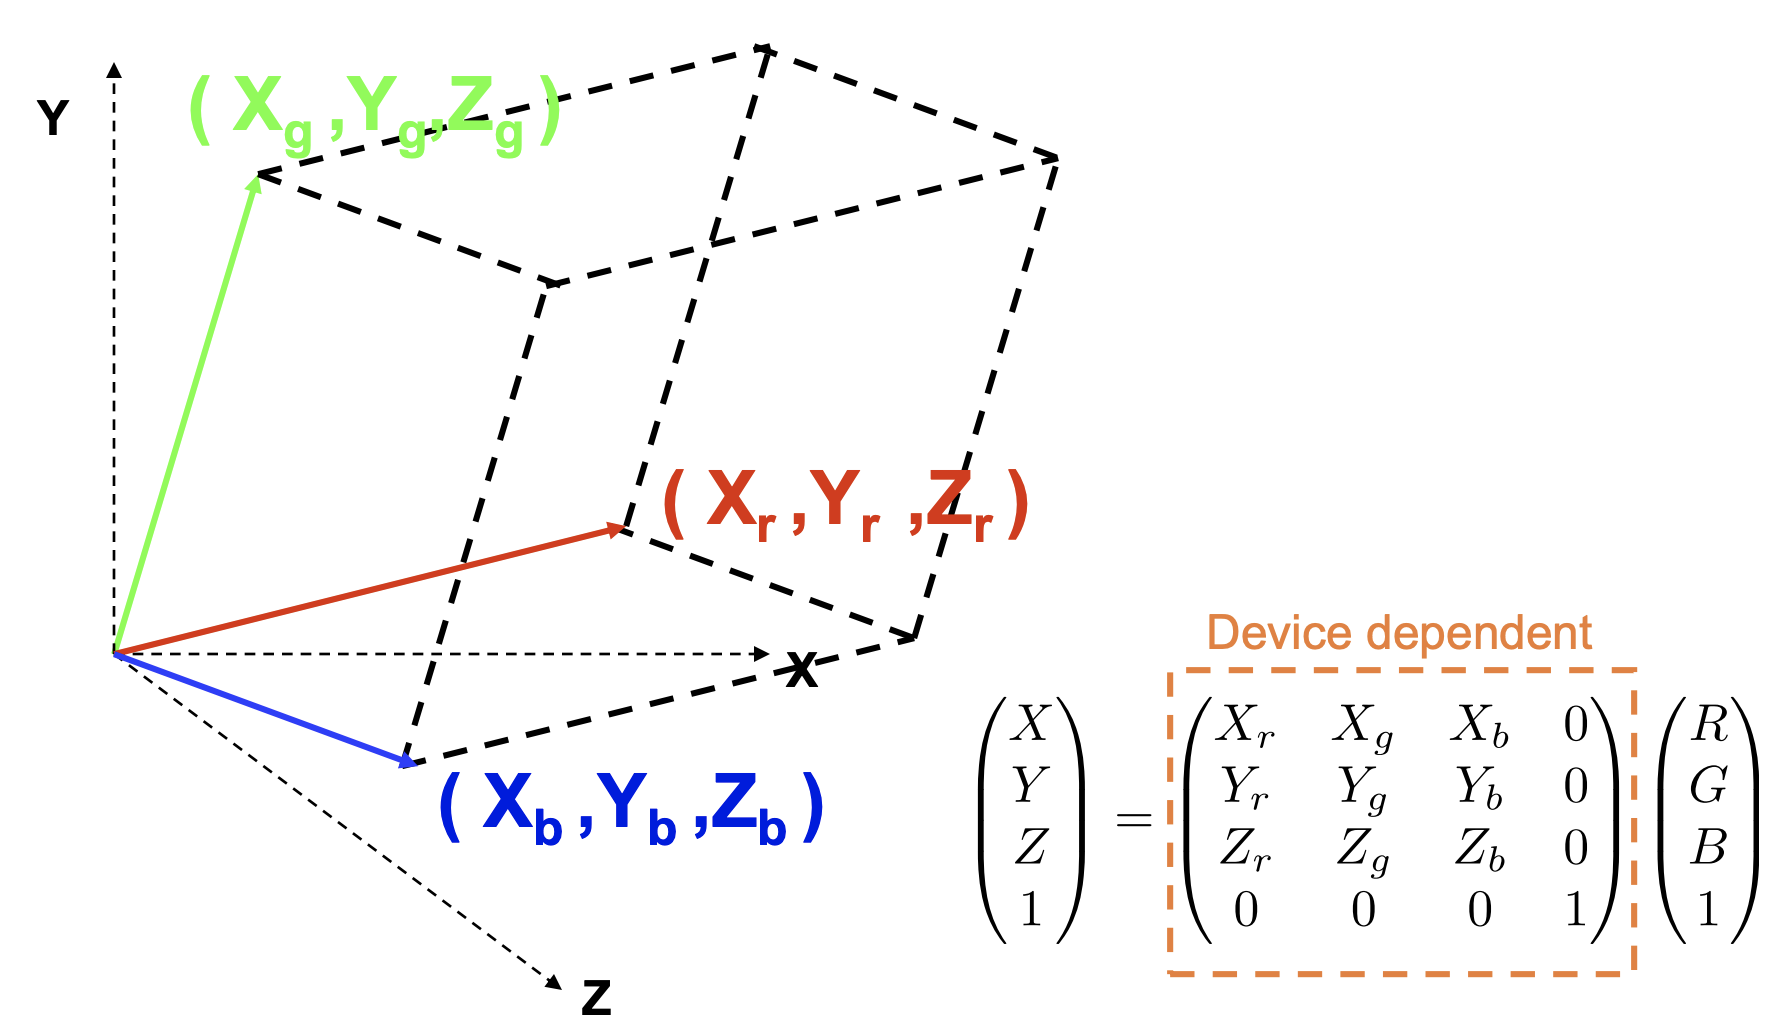
Linear Devices 的矩阵表示
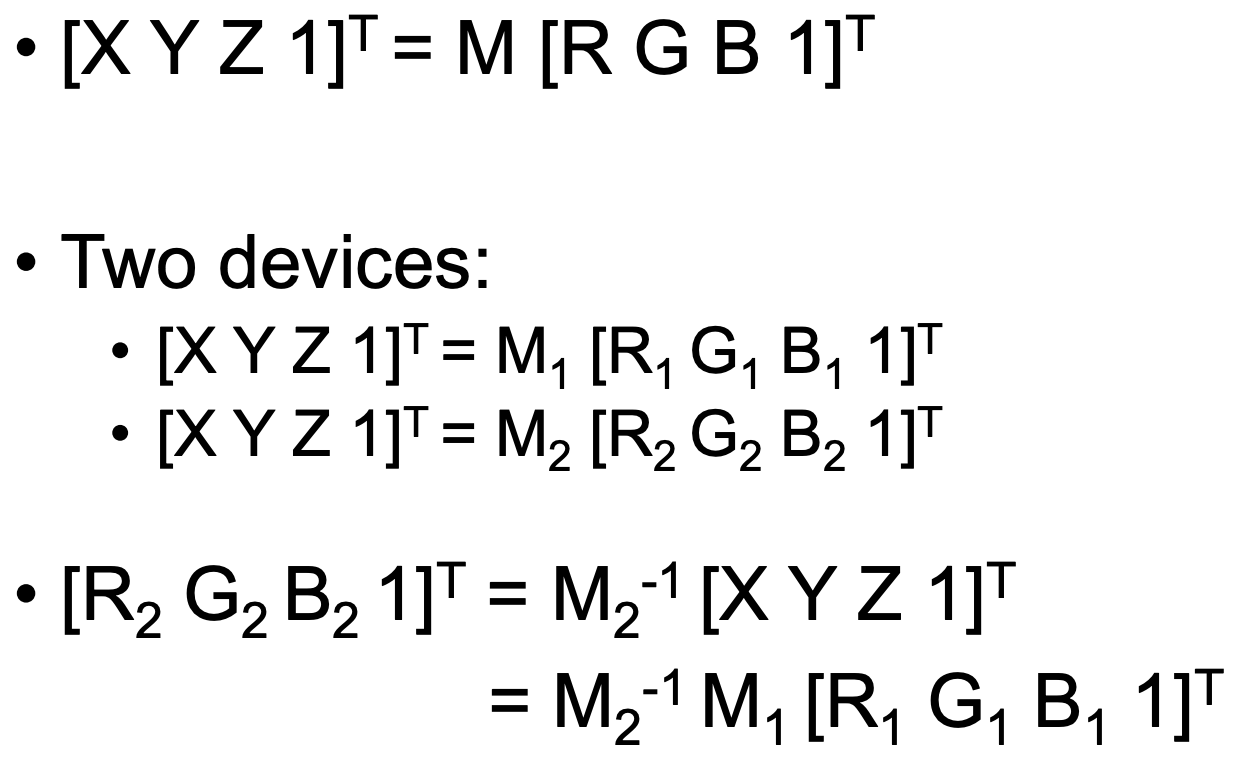
个人理解:xyz是针对人的眼睛的,每个人感知到的都一样;而rgb是针对屏幕的,从前面色域的图猜测不同的显示屏会规定不同的标准红绿蓝的位置,其余颜色的计算就是以这三个点为核心。
Display
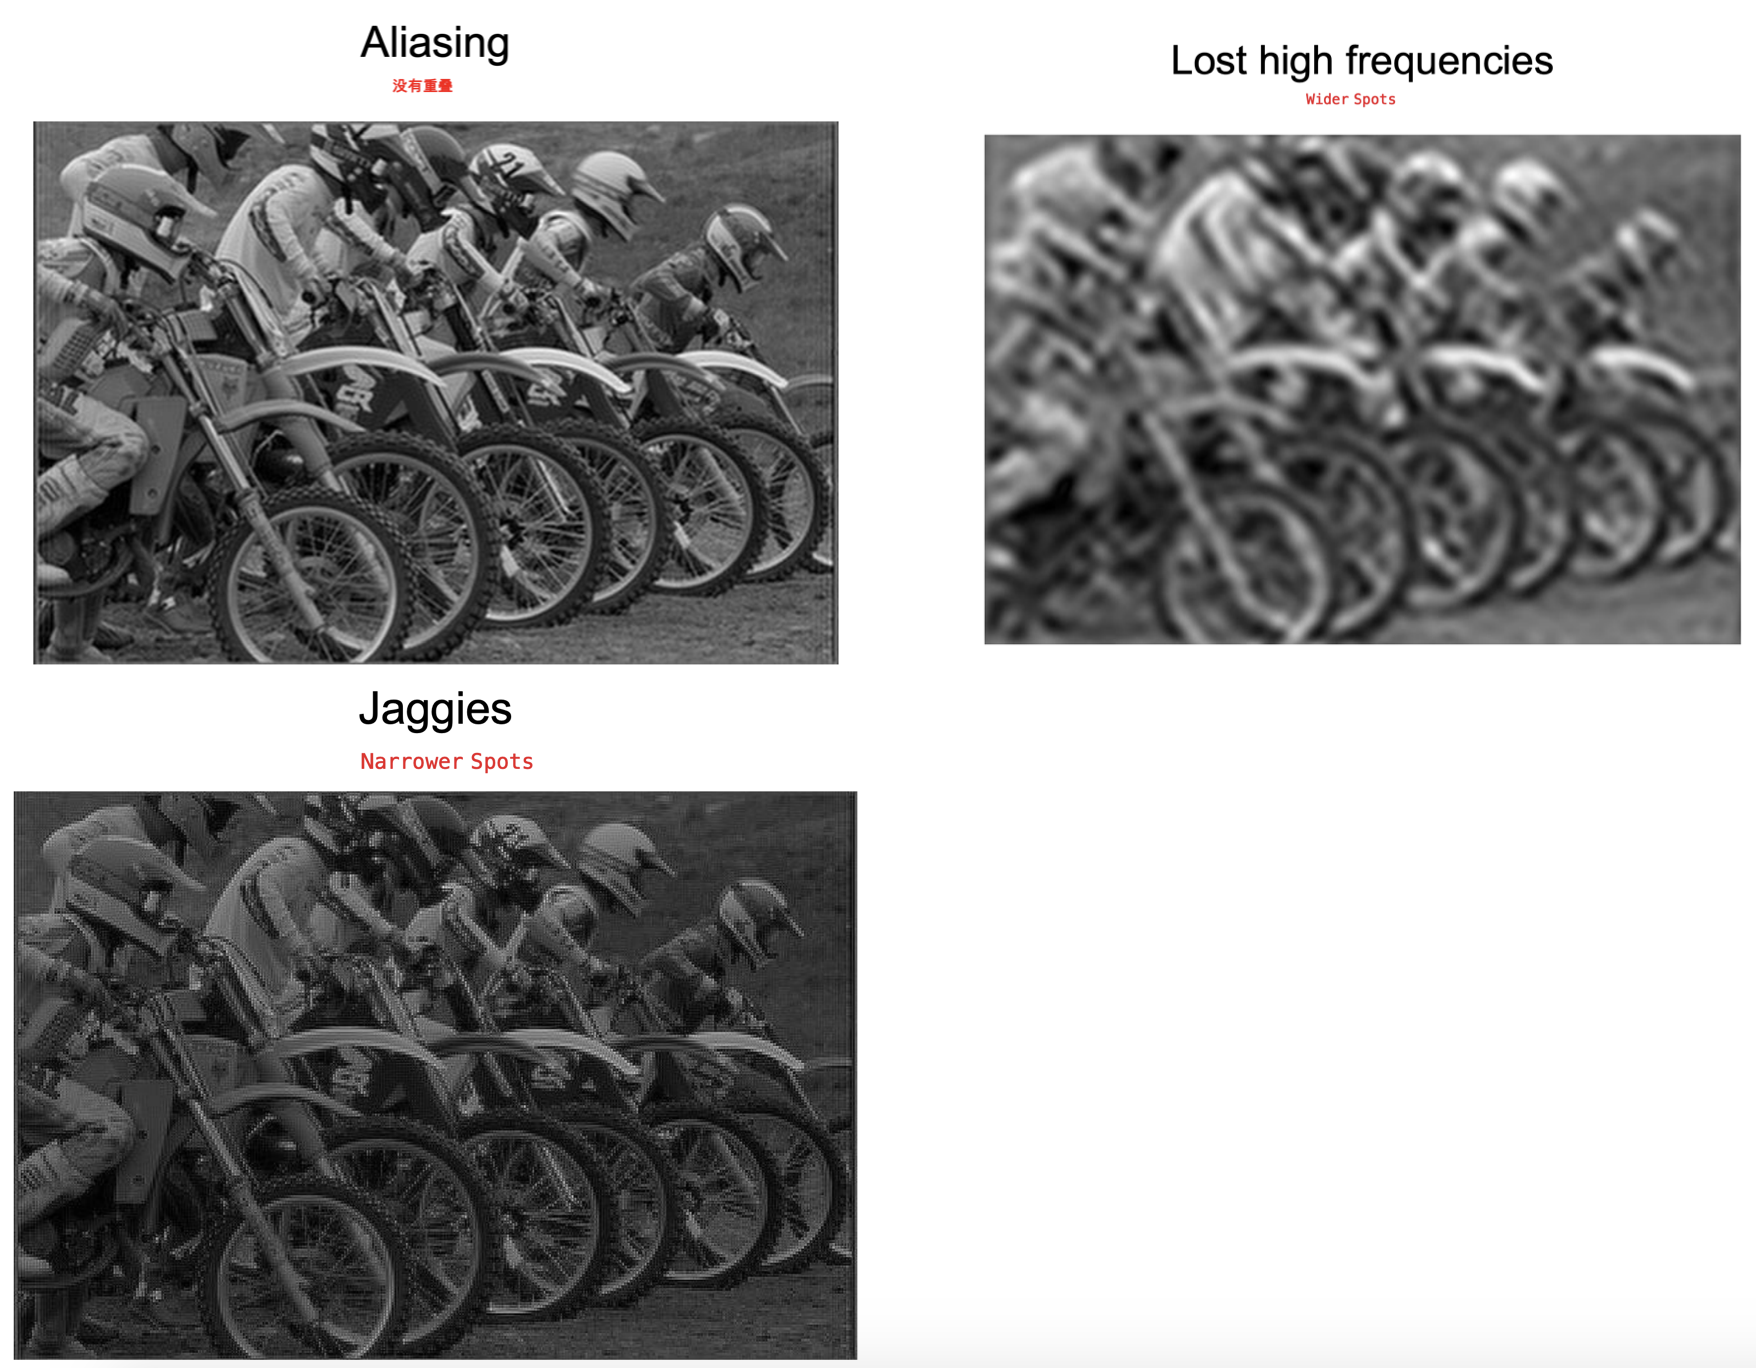
Image generation: 生成数字图像,注意采用上一篇文章所述的方法避免产生 non-aliased images
Image reconstruction: 在显示屏上生成连续的图像 我猜是多帧图像,前一帧过去了下一帧如何渲染
每个像素点实际上是一块区域,这片区域是怎么被 lighted 呢?
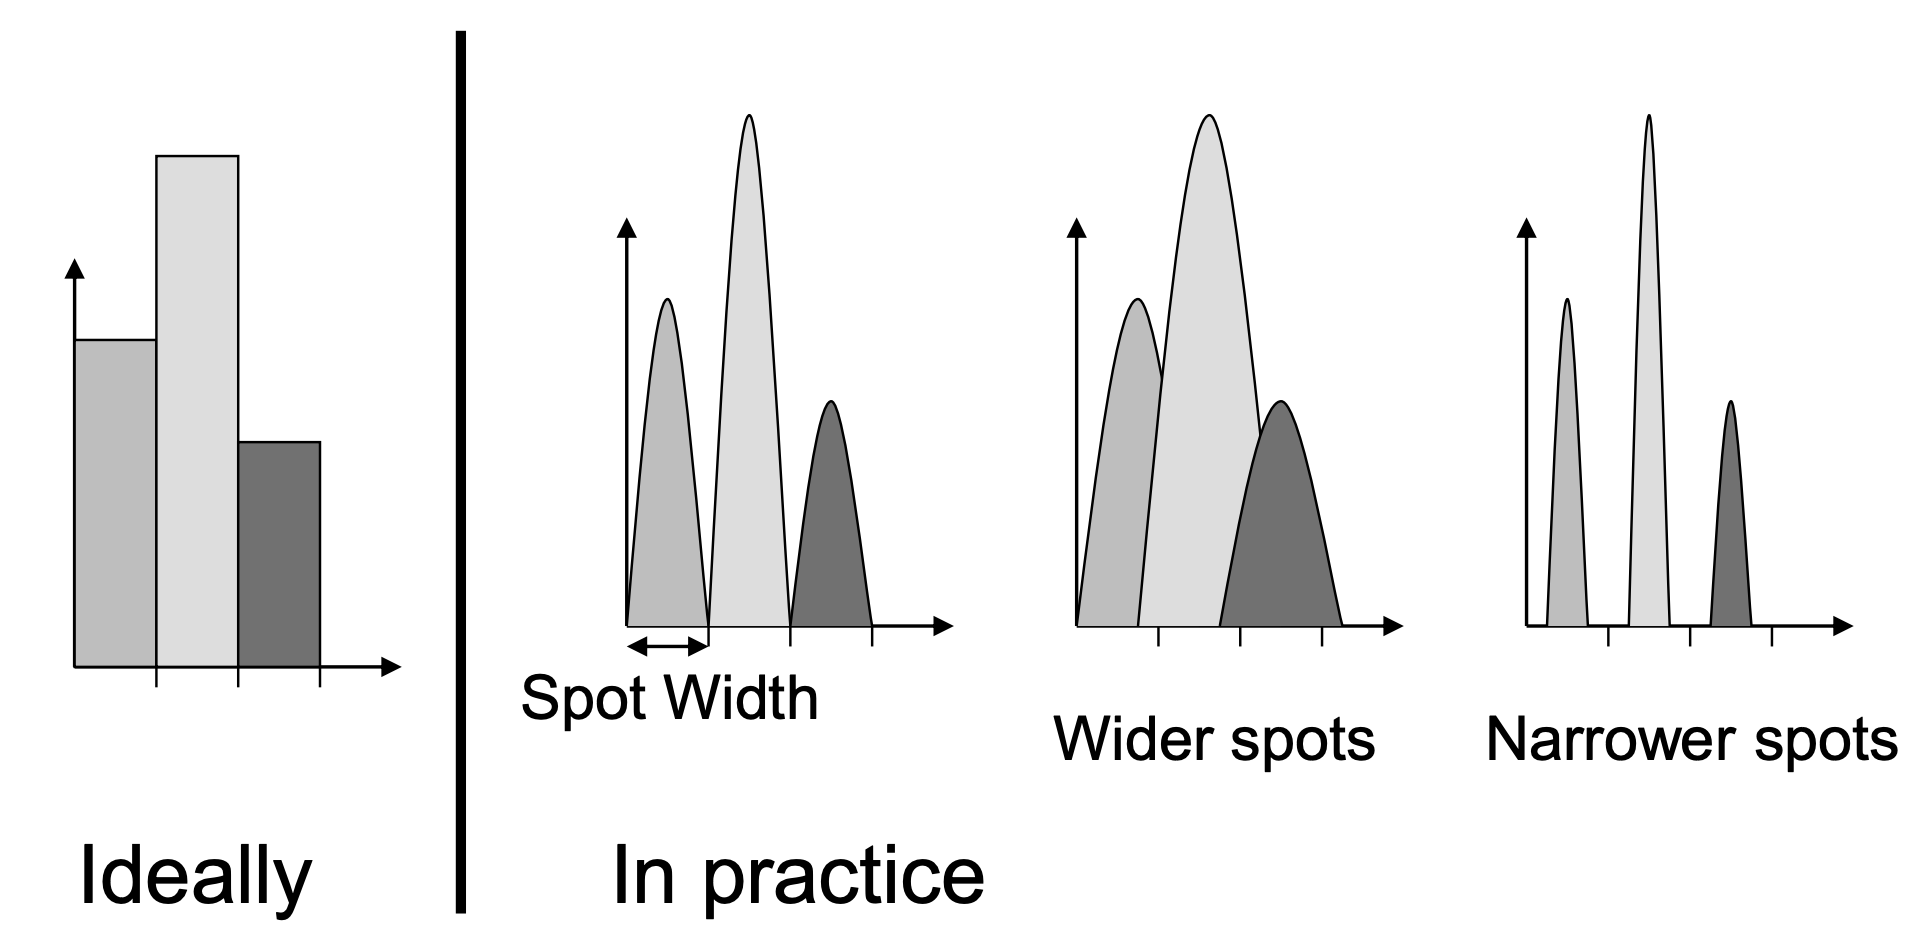
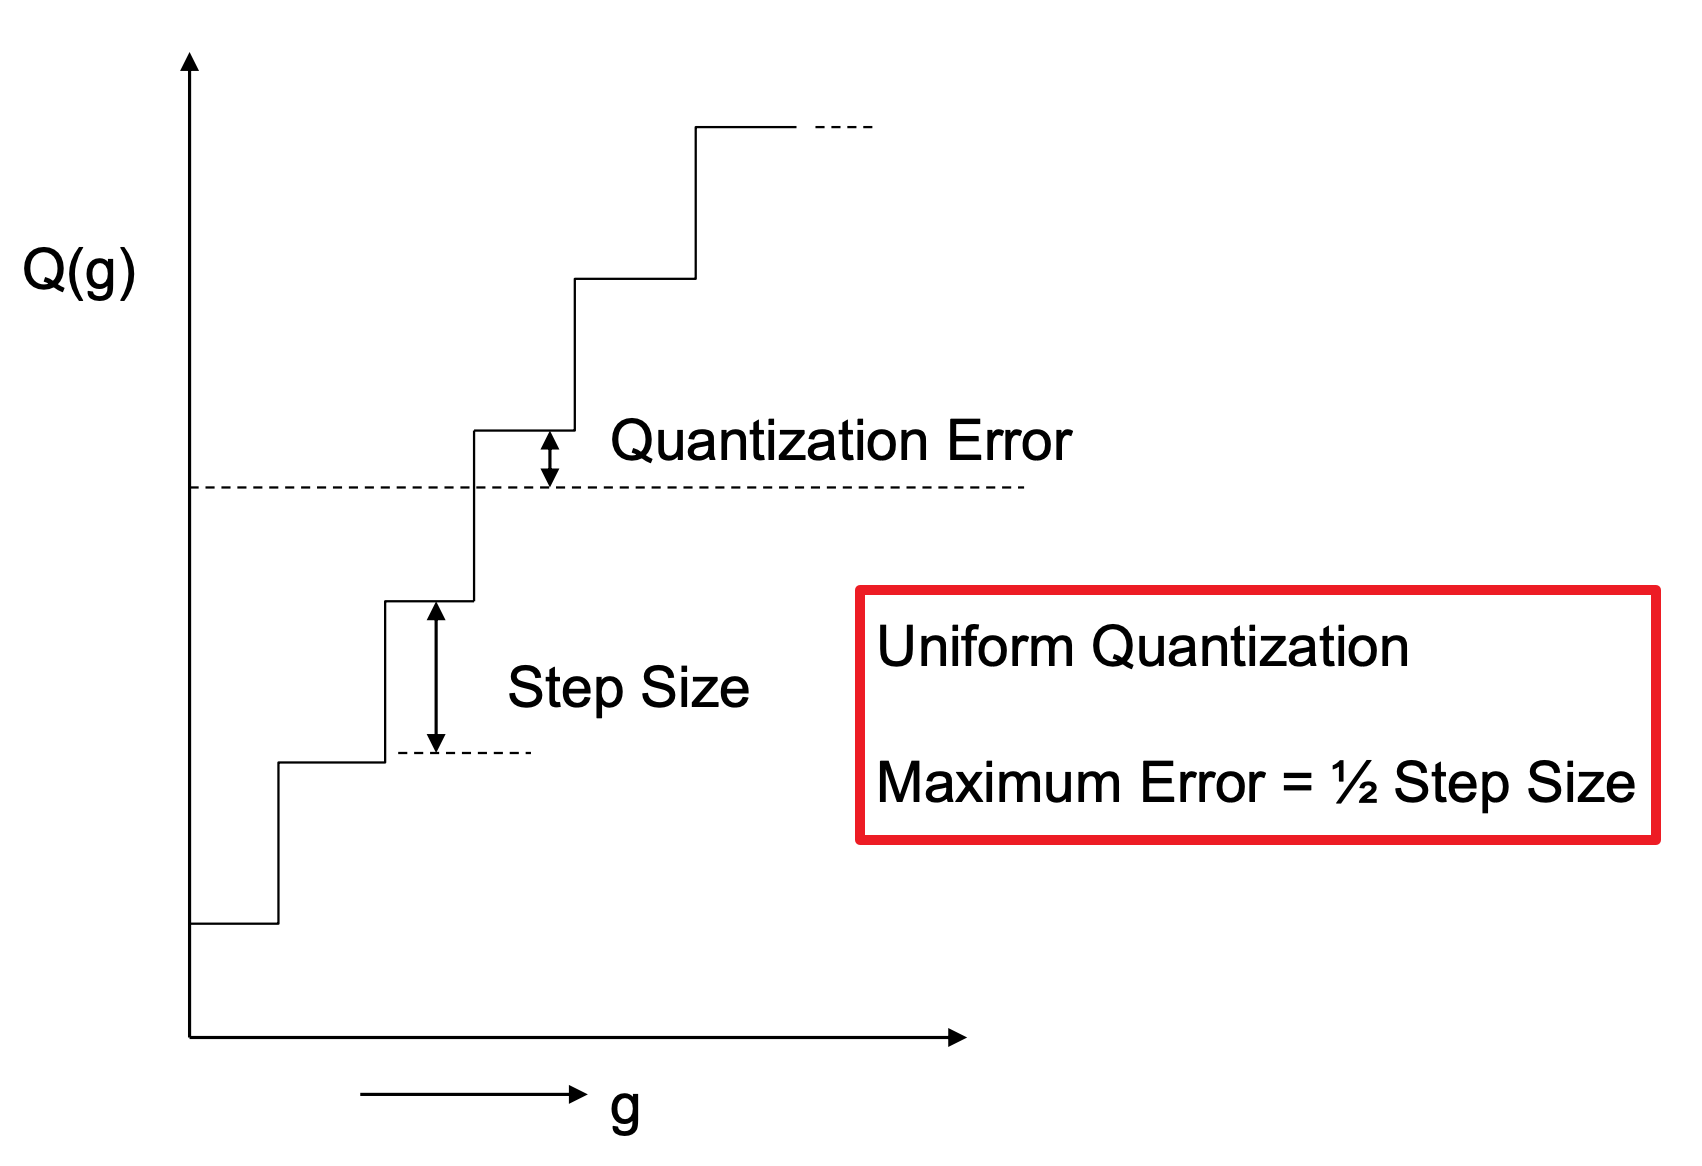
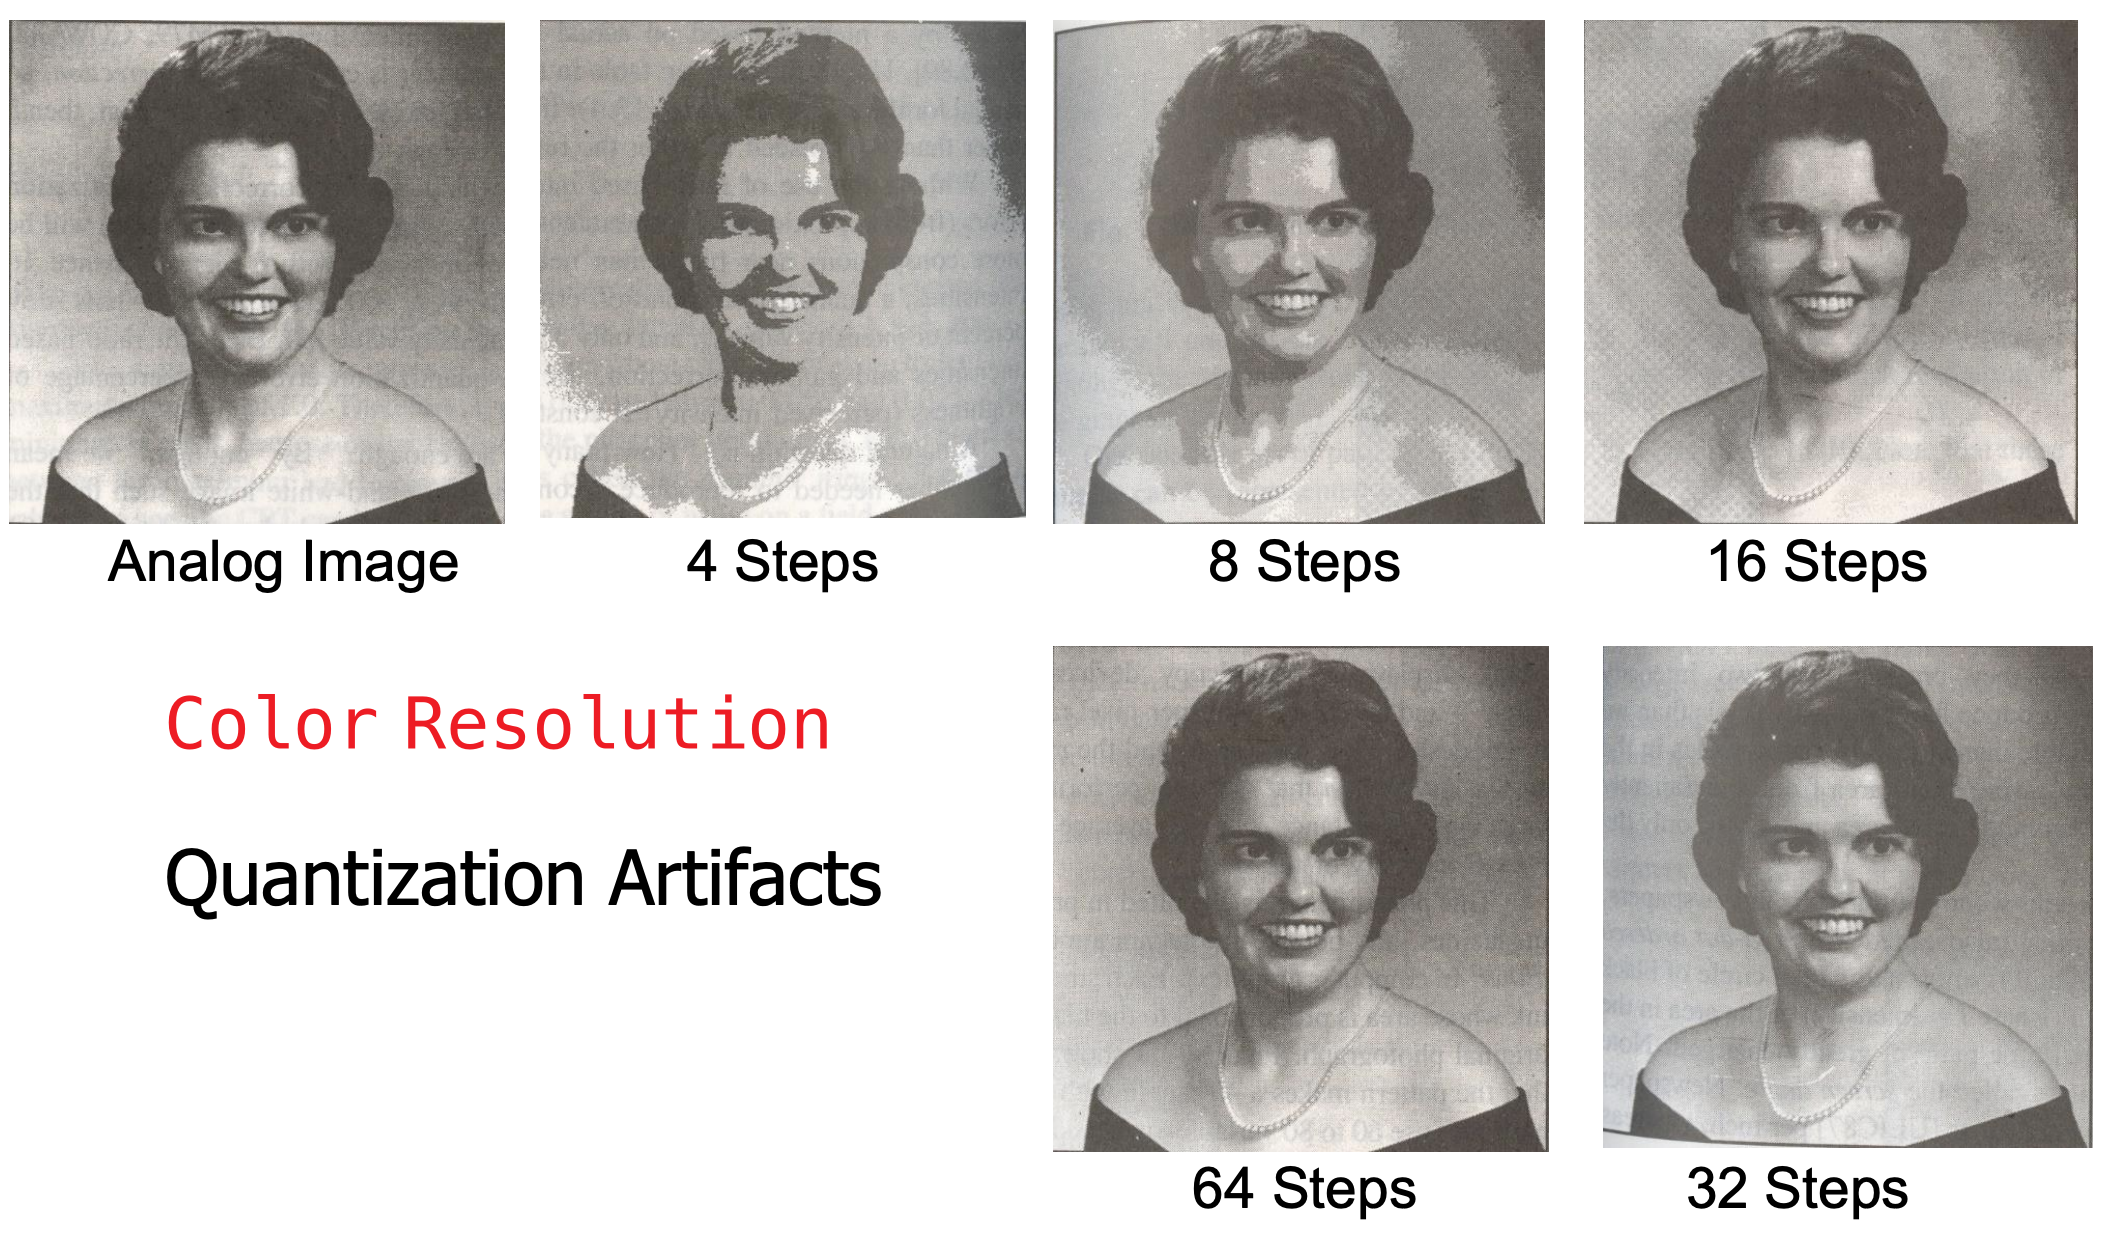
Quantization: Digitization of brightness/color
目的:为了减少一张图像中的颜色数使它尽可能和原始图像一样。
Gray scale: 用0~1表示一系列的灰(infinite levels of gray),8位的表示能达到256种灰度。
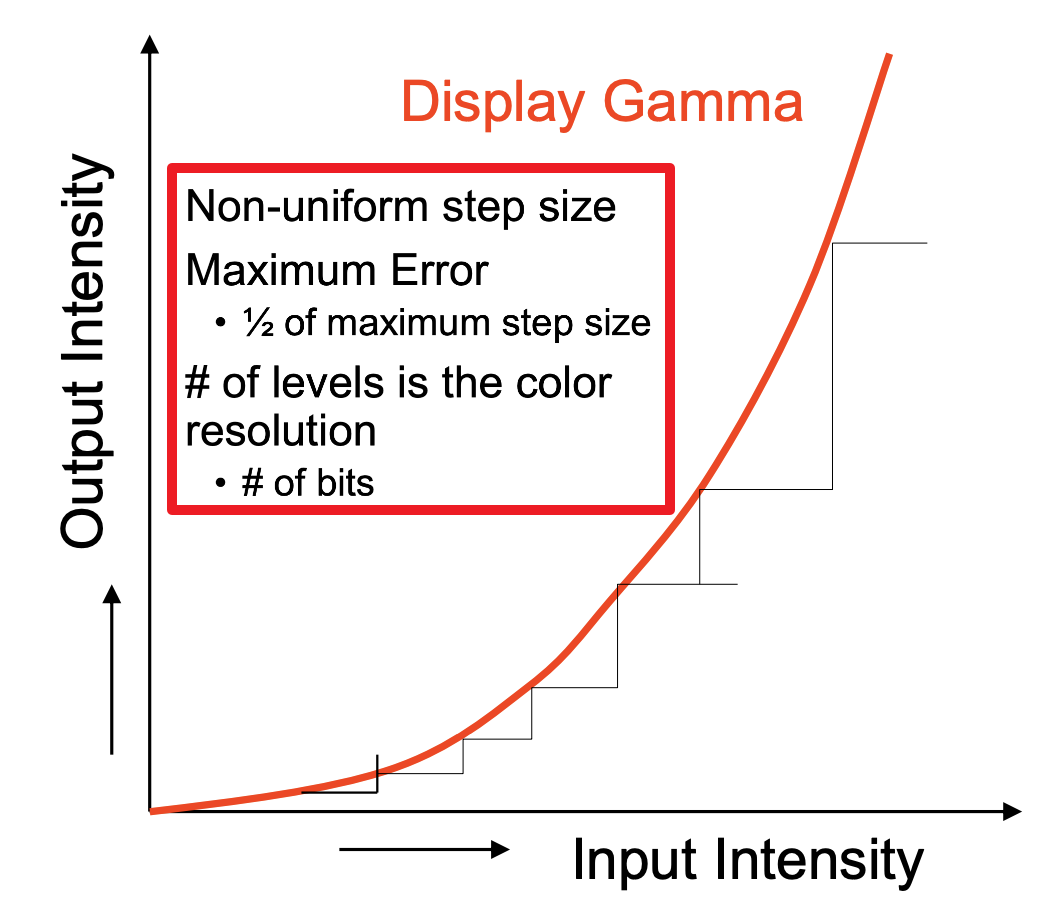
Quantization Error: 模拟信号 和 数字信号差距 ⬇️
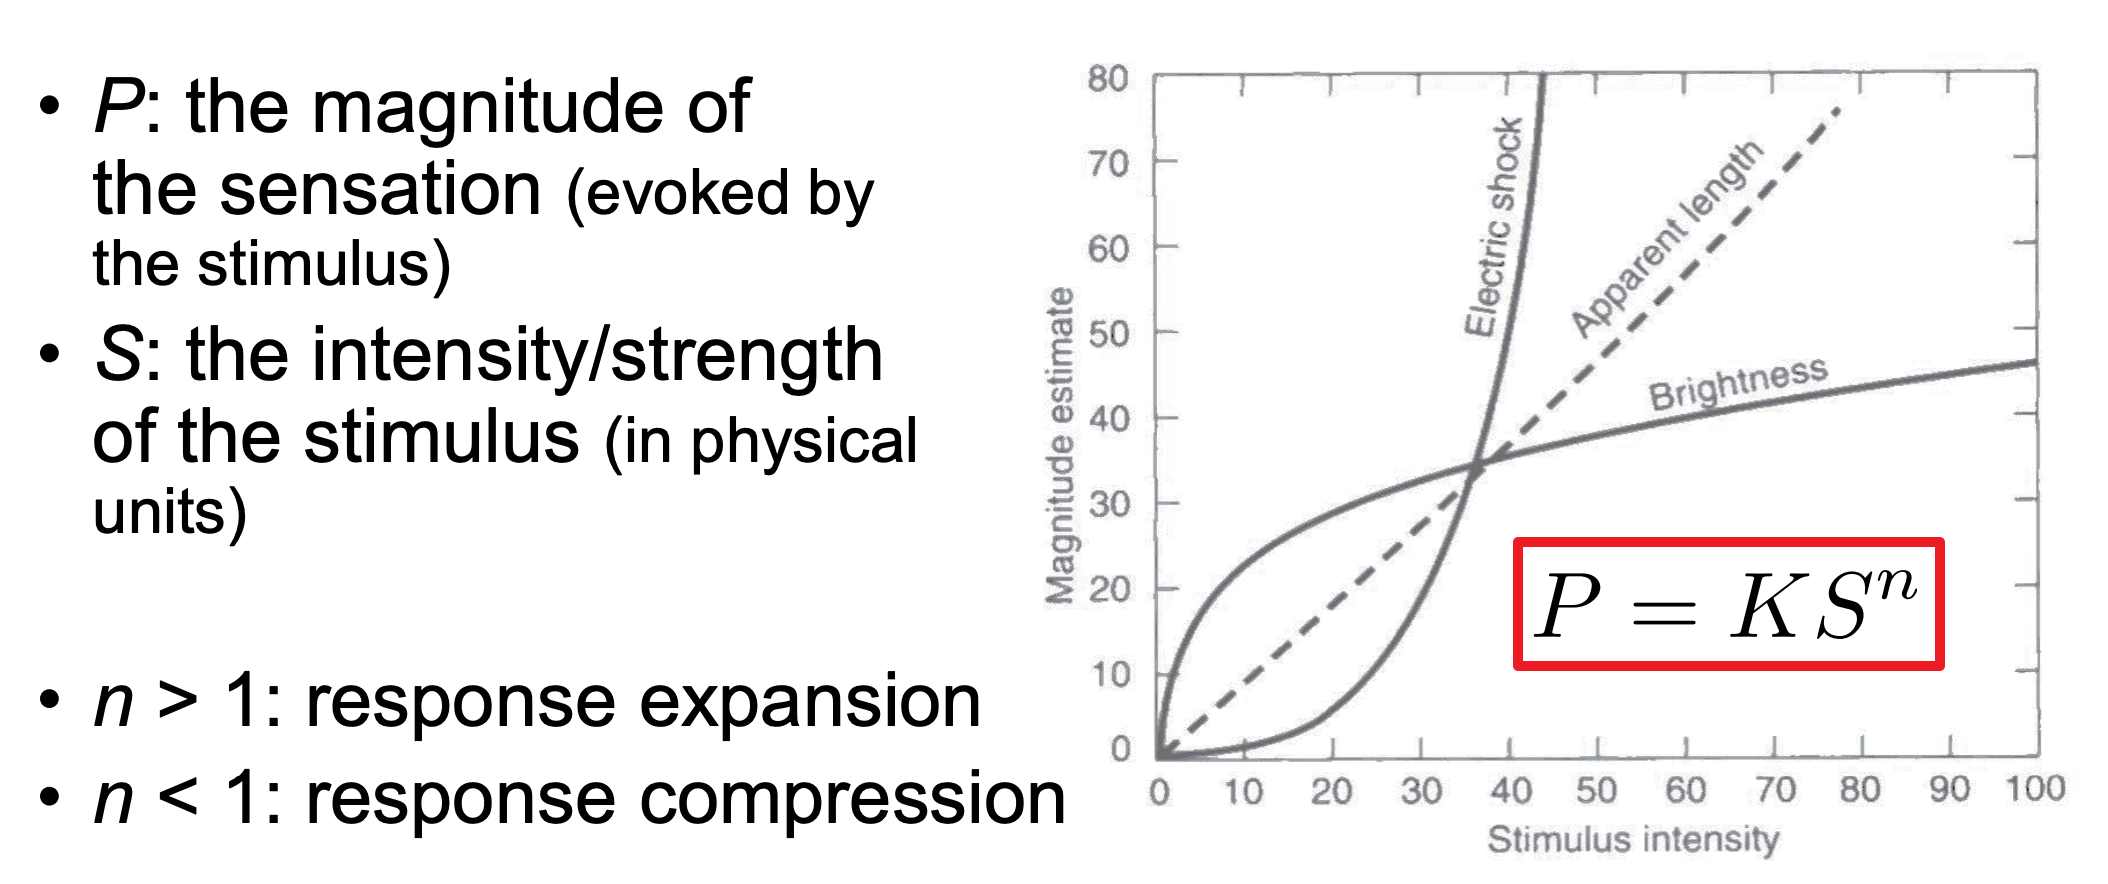
Human Perception - Steven’s power law
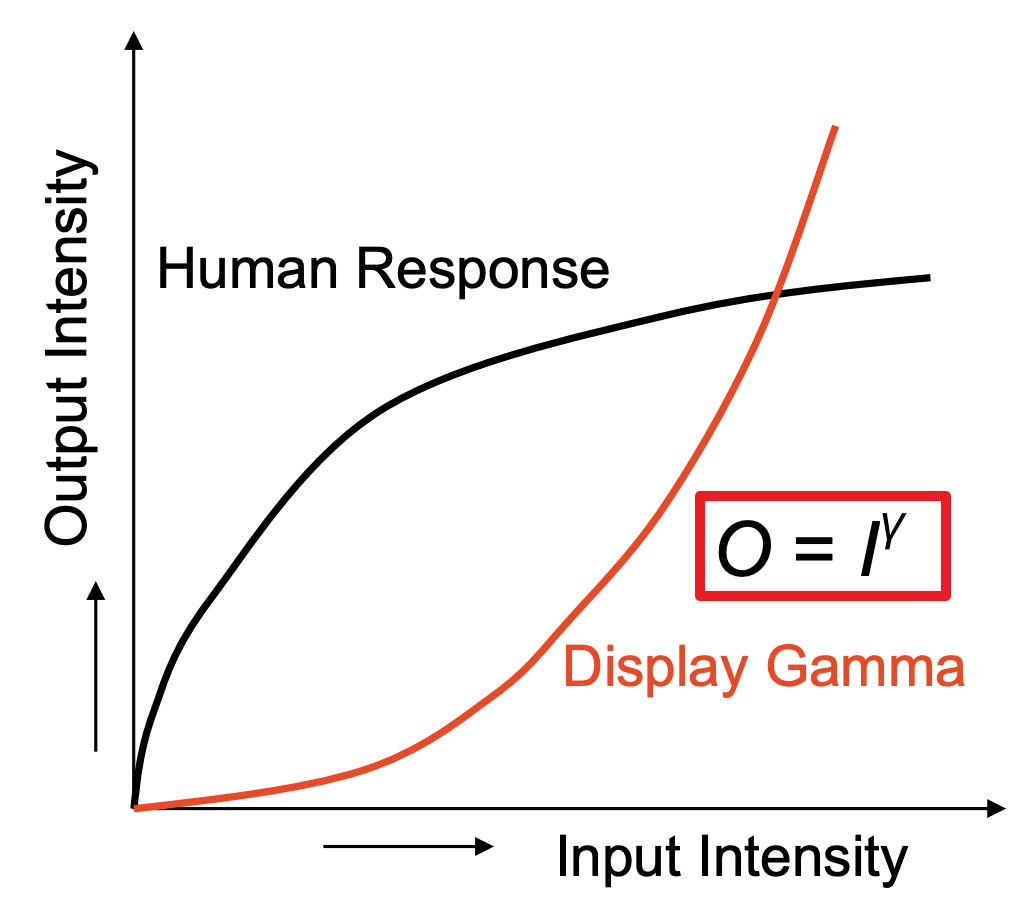
Gamma Function: Inverse of human response curve for faithful representation of intensities
为图像进行伽马编码的目的是用来对人类视觉的特性进行补偿,从而根据人类对光线或者黑白的感知,最大化地利用表示黑白的数据位或带宽。在通常的照明(既不是漆黑一片,也不是令人目眩的明亮)的情况下,人类的视觉大体有伽马或者是幂函数的性质。如果不将图像进行伽马编码,那么数据位或者带宽的利用就会分布不均匀——会有过多的数据位或者带宽用来*表示人类根本无法察觉到的差异*,而用于表示人类非常敏感的视觉感知范围的数据位或者带宽又会不足。图像的伽马编码并不是必须的(甚至有的时候会适得其反),浮点数格式的颜色值已经提供了一部分对数曲线的线性估计。——from 维基百科
Dithering 用于降低量化误差,通过在较低比特中加入噪声,借此破坏谐波的排序,使谐波的影响受到压制,并减少量化误差在低频的影响。抖动最重要的用途之一是将灰阶图像转为黑白。通过使用抖动算法,可以令黑白图案的黑点密度接近原图案的大致灰度。——from 维基百科
Trading off spatial resolution for intensity resolution 点的密度 - 点的颜色
参考:
1.这篇文章介绍了颜色量化的三种方式,流行色算法、中位切割法、八叉树颜色量化。
2.同上,侧重于讲八叉树颜色量化。
3.一个像素是如何绘制到屏幕上去的?这篇文章也许能给你答案,太长了我没看,mark 一下。