PPG小组 TROIKA
阅读论文《TROIKA: A General Framework for Heart Rate Monitoring Using Wrist-Type Photoplethysmographic Signals During Intensive Physical Exercise》
作者的 homepage 2017年后的数据没再更新了,可能在学术界不活跃了?研究方向偏向于数据挖掘,信号处理之类,还涉及金融领域和医疗健康领域,是我比较喜欢的领域。
前言
第一个碰到的名词就不太懂 Power Spectrum Estimation 翻译成中文就是功率谱估计,定义是利用给定的一组样本数据估计一个平稳随机信号的功率谱密度。
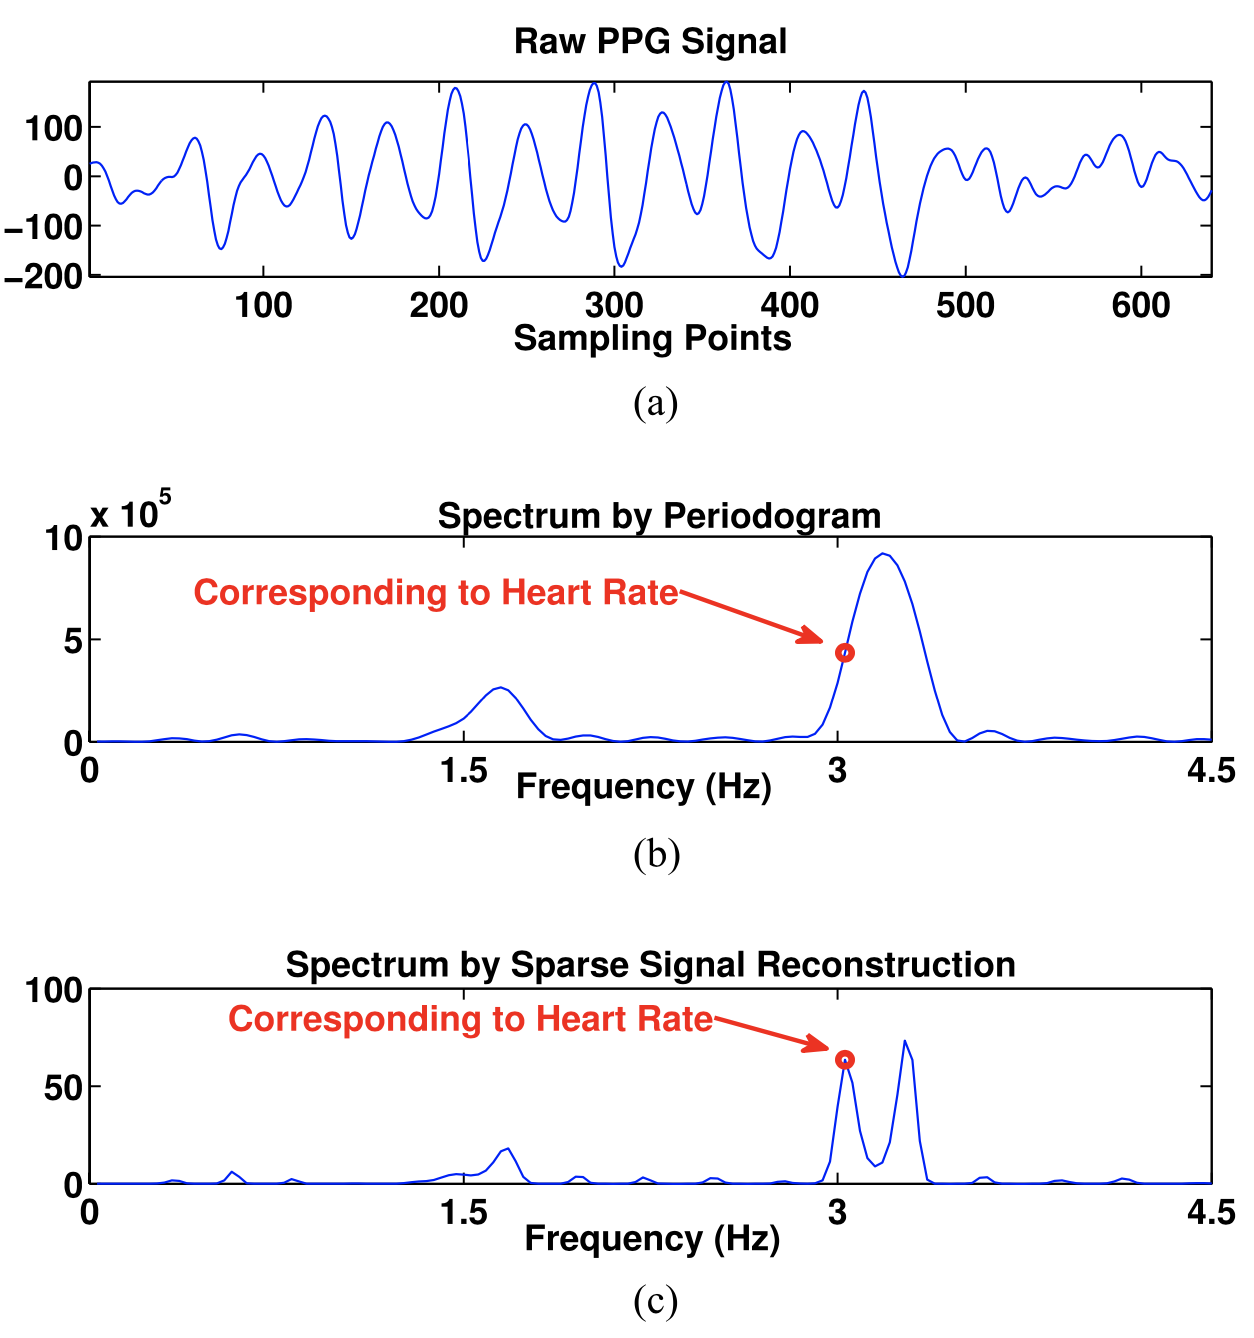
其中第二篇非常详细地介绍了各种不同的实现方法,文献中最先采用了传统傅里叶变换分析方法中的周期图法,然后提到了music算法但说它需要 model order selection 有点难,所以它提出了用 SSR-based spectrum estimation,该分析技术的前提是被估计的频谱是稀疏或压缩的,也就是说只有几个谱系数为非零值。
为了使得带有MA的PPG信号满足这个要求,我们需要对信号进行预处理。下图是两种不同方法的效果对比:
TROIKA
该论文提出的信号处理框架,可以看到第一步使用了0.4~5Hz之间的带通滤波器(根据之前的文献资料,心跳的频率在0.5~4Hz内,呼吸的频率在0.2~0.35Hz内,MA噪声大概在大于0.1Hz的范围)
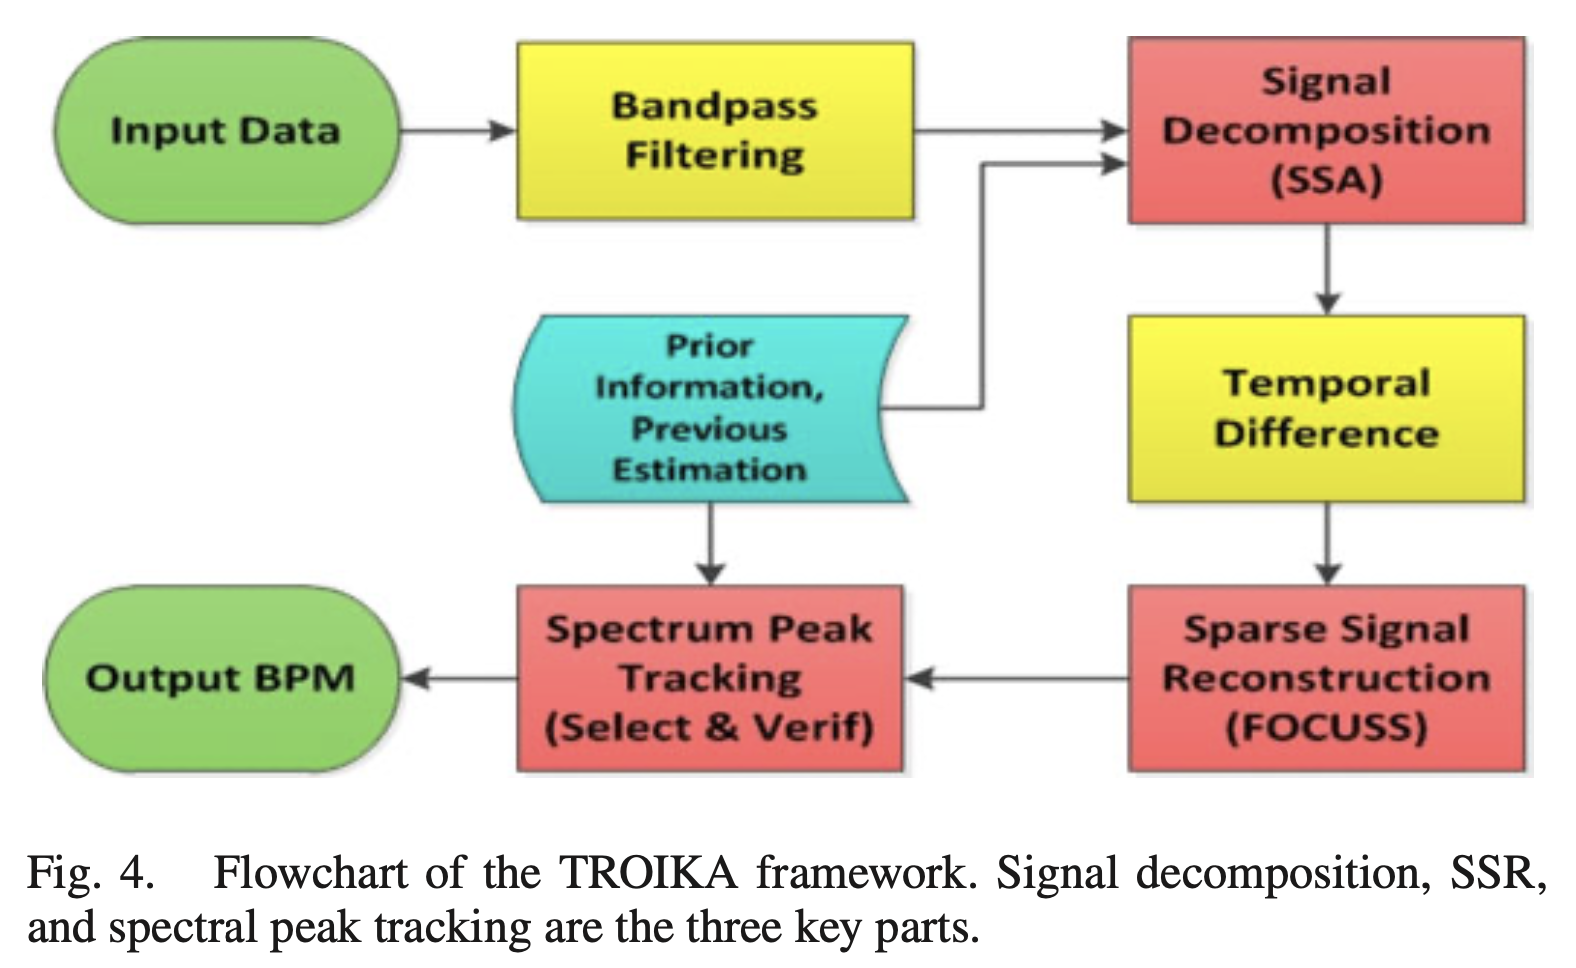
TROIKA 三步走
- signal decomposition 去除原始PPG信号中的MA,并且稀疏其频谱
- sparse signal re-construction (ssr) 计算高分辨率PPG信号的频谱
- spectral peak tracking 寻找心率对应的光谱峰(spectral peak)
details
数据集:单通道PPG信号,三轴加速度信号和ECG信号
T秒的滑动窗口,以S的步长增加(S <= T/2,T = 8, S = 2)
(1) signal decomposition
目的:降噪 / 稀疏化PPG信号的频谱
方法有:singular spectrum analysis (SSA) / single-channel independent component analysis 等等
他们选择了 SSA,包括四个步骤: Embedding, Singular Value Decomposition (SVD), Grouping, and Reconstruction.
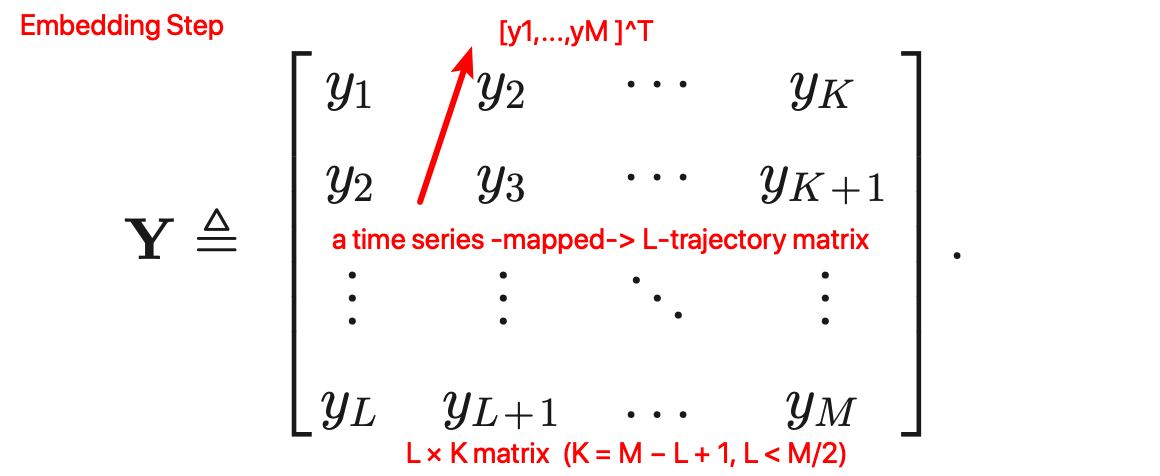
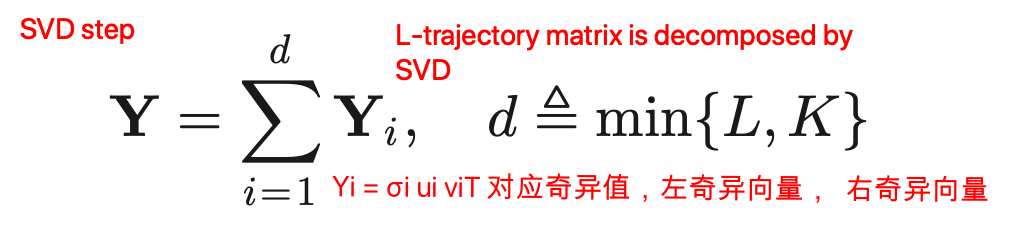
clustering singular values [23, pp. 66] ⬇️
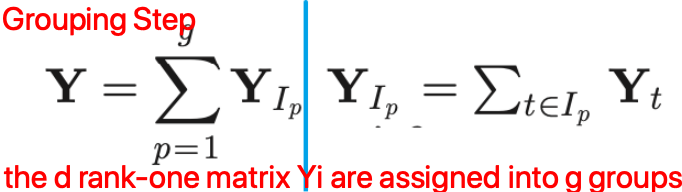
那怎样来辨别哪些部分是MA噪声呢?
首先使用 periodogram 来计算 dominant frequencies(幅度大于50%波谱中最大振幅的峰值)来确定加速度数据每个通道的频谱。F_acc 用来表示 set of location indexes of selected dominant frequencies in spectra.
其次按照上图所示的四个步骤走,grouping 之后 remove the time series whose dominant frequencies have location indexes in F_acc,剩余的信号用于重建PPG。
上述去除的过程可能会不小心去掉和心跳有关的信息,用 N_p 表示 the location indexes of fundamental and harmonic frequencies of the heartbeat estimated in the previous time window,在 F_acc 中排除掉 {Np − Δ,···,Np − 1,Np,Np + 1,…,Np + Δ}
注:划线部分没搞清楚具体的操作
一些参数设置:L = 400, #FFT points = 4096,Δ = 10,sampling rate = 125 Hz
参考资料:Singular Spectrum Analysis for time series forecasting in Python
(2) Temporal Difference Operation
对得到的信号做二阶差分
为什么这么做呢?因为k阶差分能显著的表示基础频率和他的谐波频率。心率信号是周期的,MA信号是非周期的。
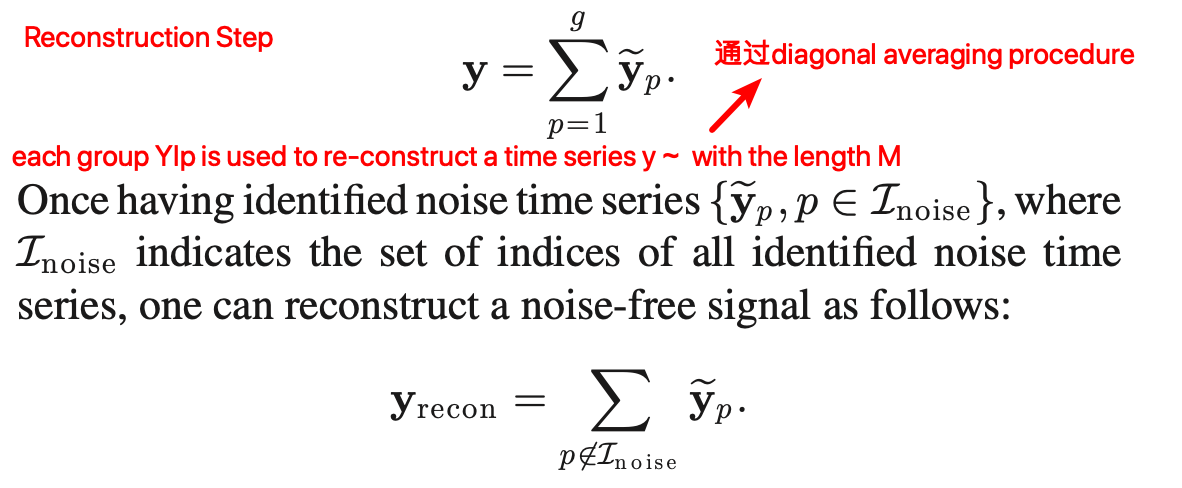
(3) Sparse Signal Reconstruction
目的:生成 high-resolution spectrum estimation
SSR模型:
y is an observed signal of the size M × 1
x is an unknown solution vector which is assumed to be sparse or compressive
v is an unknown noise vector
目标是基于 y 和 Φ 找到稀疏矩阵 x,可以根据以下公式:
λ is a regularization parameter
g(x) is a penalty function encouraging the sparsity of the x
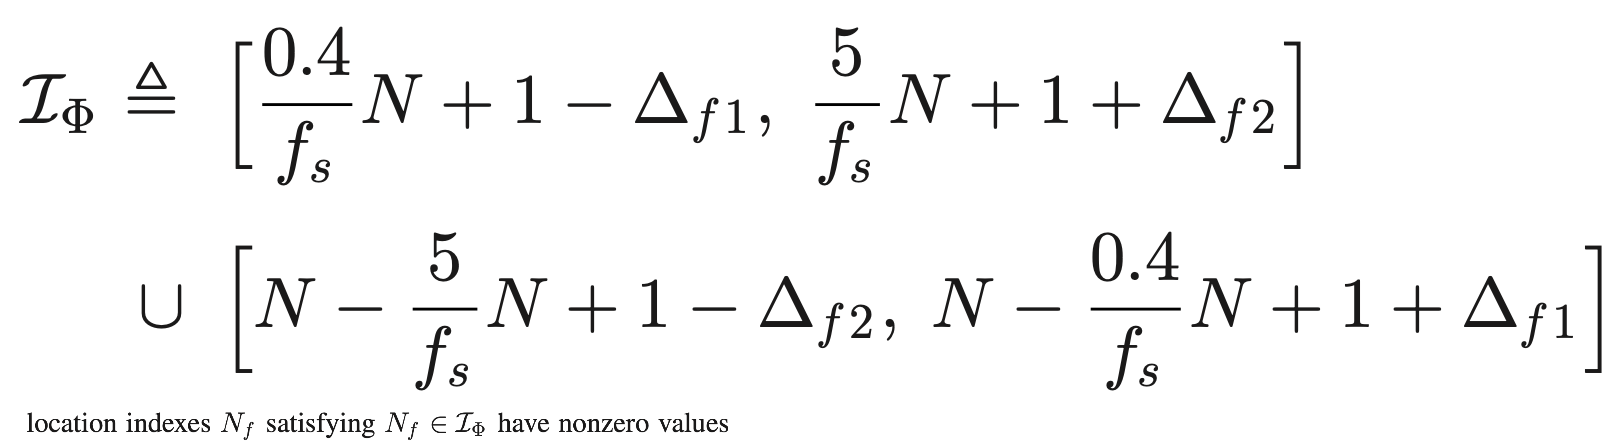
初始化 Φ 为:
当按照上述式子计算时,因为Φ非常大,所以计算量很大,一般在计算前会对Φ剪枝

当M远小于N时,Φ的列高度相关,这种情况下SSR算法效果不好。文章采用了FOCUSS算法,该算法在列向量高度相关时表现也很鲁棒
这里不理解高度相关是怎么判断出来的?
(4) Spectral Peak Tracking
目的:选择正确的谱峰 / 处理峰值受到MA干扰不存在的情况
(1) Initialization
要求实验对象在实验开始阶段尽量减少手部动作(大概2~3s),通过该阶段选择PPG频谱中最高频峰来估计心率
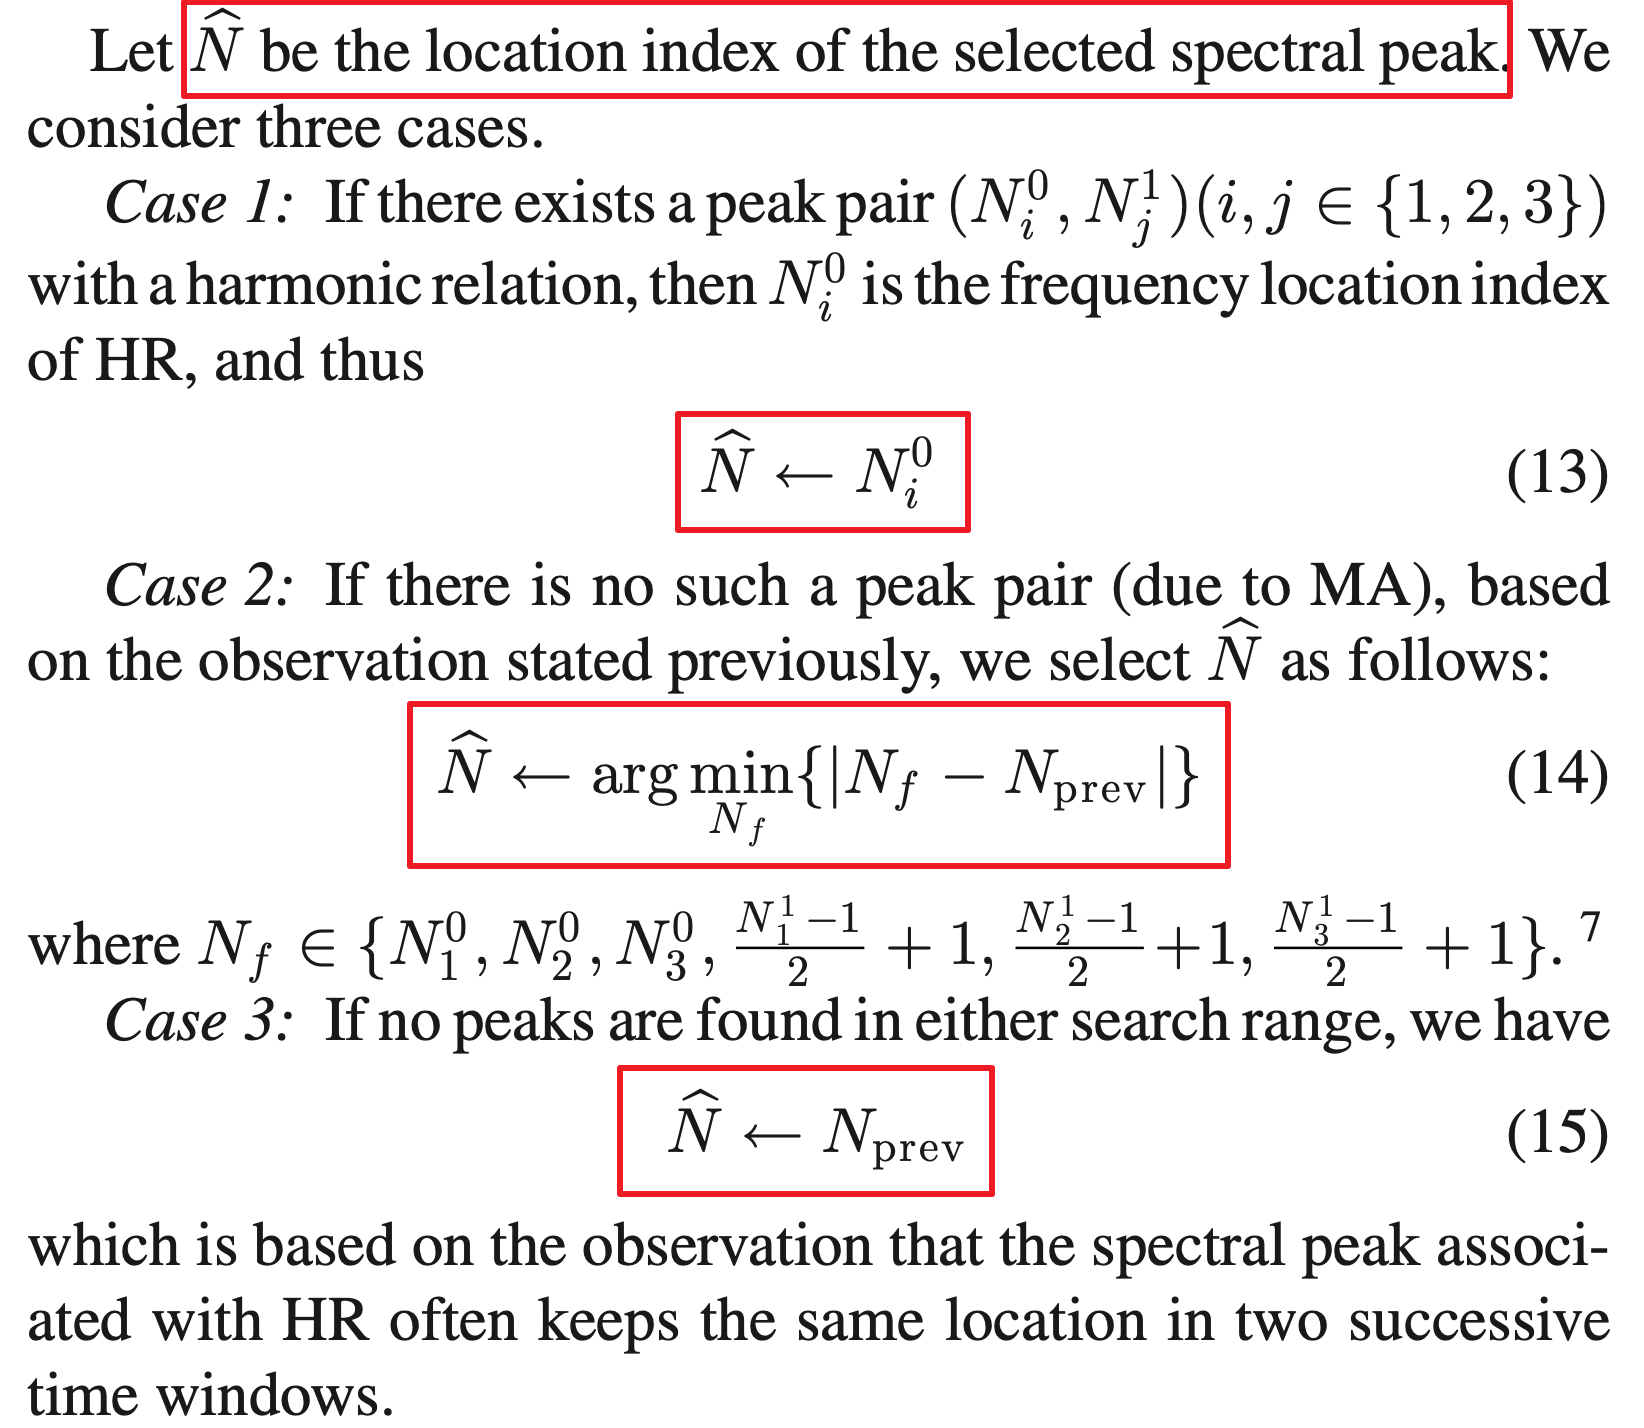
(2) Peak Selection
Nprev: frequency location index of HR estimated in the previous time window
R0 = [Nprev−Δs, …, Nprev+Δs]
R1 = [2(Nprev−Δs−1)+1, …, 2(Nprev+Δs−1)+1]
在这两个搜索范围里,选择3个higest peaks with amplitude no less than a threshold η
frequency location indexes of the three peaks in R0:
indexes of the three peaks in R1:
参数:Δs = 16,η = 30% of the highest peak amplitude in R
(3) Verification 目的:prevent the wrong tracking
Rule1: prevent a large change in the estimated BPM values in two successive time windows
the whole spectrum [0, 125] (Hz) is divided into N = 4096 grids -> a change of six locations in the spectrum means a change of about 11 BPM 这怎么计算?
参数:θ = 6,τ = 2
Rule2: prevent from losing tracking over long time
如果有很强烈的MA,每次用前一次的波谱来代替当前时刻的,导致信号丢失无法找回。所以如果 N = Nprev 出现了连续h个滑动窗口,那么就:
参数:如果该现象发生,则Δs = 20;如果不发生,则Δs = 16,h = 3,The predicted BPM was obtained by using the third-order Polynomial curve fitting on the estimated BPM values in previous 20 time windows.
results
ground truth: 通过ECG信号(不经过任何处理)得到的60H/D (in BPM)
误差计算公式:
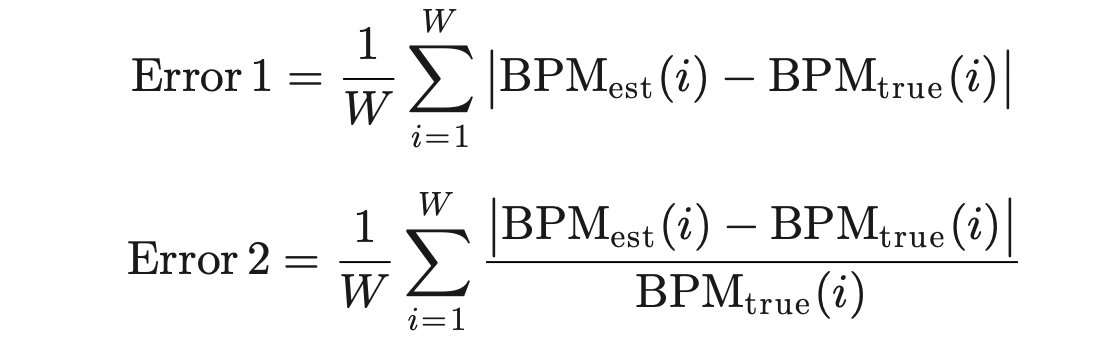
W is the total number of time windows
展示了 error1/2的数据 + Bland–Altman plot
对照组:删除前述步骤中的任意一条,单个subject测得到的PPG和ECG信号对比,每一个步骤处理后信号的变化
related work
- independent component analysis (ICA) Kim and Yoo [3]
- frequency-domain-based ICA Krishnan et al. [4] (ICA的缺点:multiple PPG sensors + 对数据独立性的假设)
- adaptive noise cancelation (ANC) [6], [7] (第六篇看过,用了四种方法去除MA的信号动态选择其一作为 reference signal,缺陷就是后续的处理很容易受到参考信号的干扰 & 当对象运动时重构信号很困难)
- spectrum subtraction technique Fukushima et al. [8]
- kalman filtering using acceleration data [9] (PPG的MA是有皮肤于脉搏血氧仪表面的间隙变化引起的,和加速度度量的手部运动有区别)
- electronic processing methodology [10], time-frequency analysis [11], wavelet de- noising [12], and empirical mode decomposition (EMD)[13]